. 2010 Feb 19;285(8):5868-77.
doi: 10.1074/jbc.M109.070318. Epub 2009 Dec 15.

Processing of the matricellular protein hevin in mouse brain is dependent on ADAMTS4

Affiliations

Processing of the matricellular protein hevin in mouse brain is dependent on ADAMTS4

Matt S Weaver et al. J Biol Chem. .

Abstract

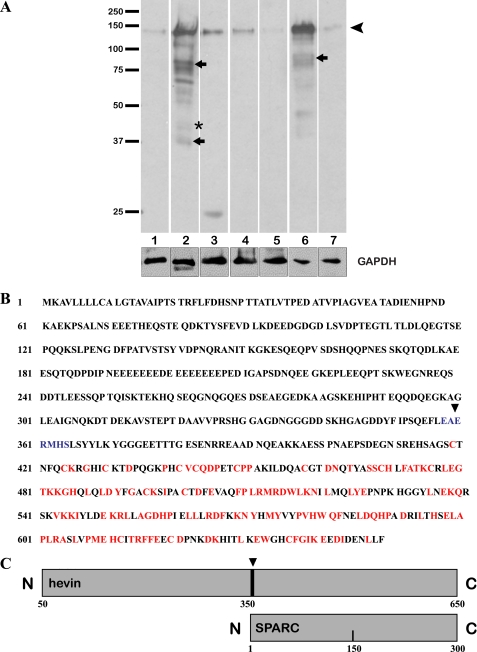
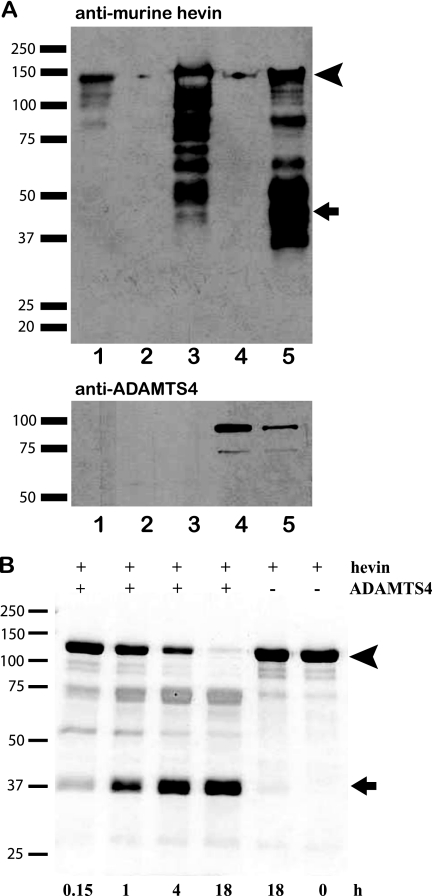
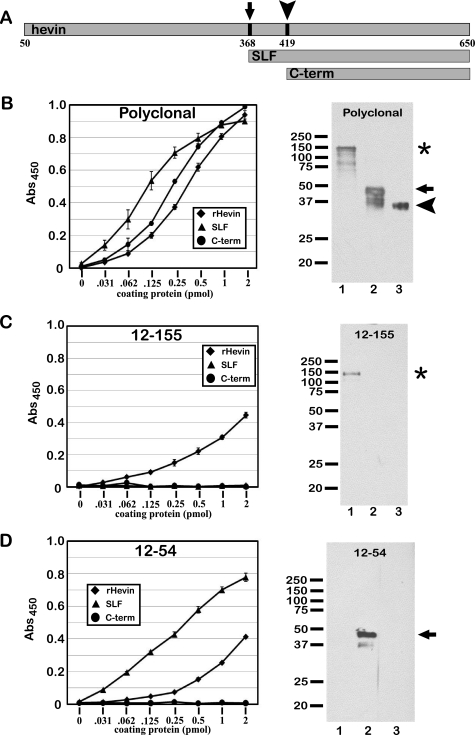
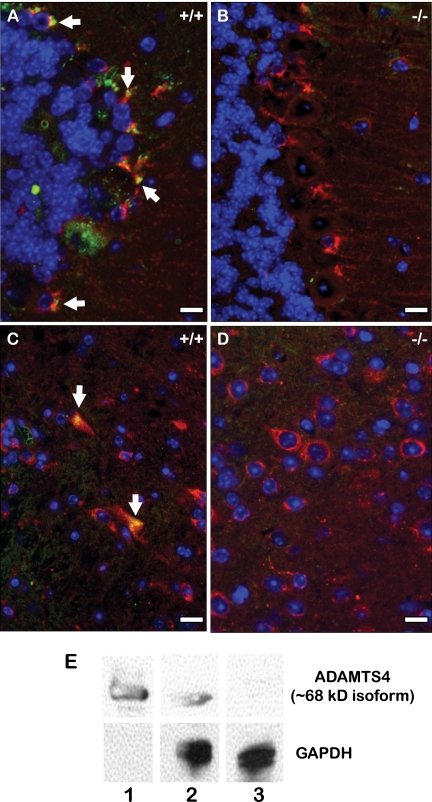
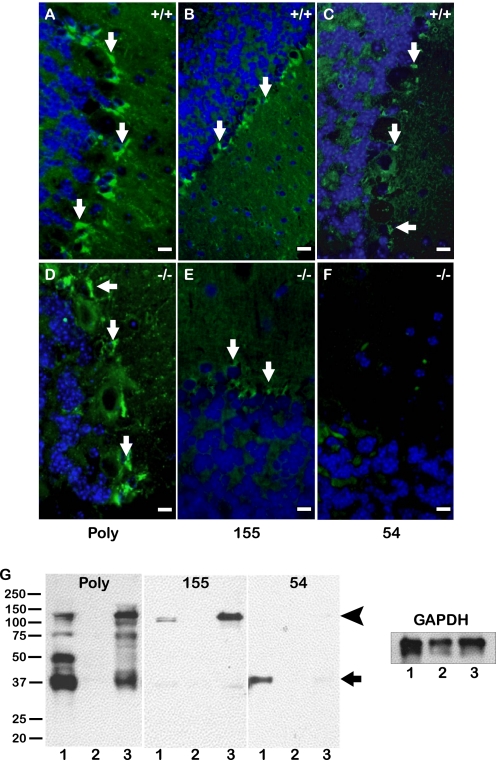
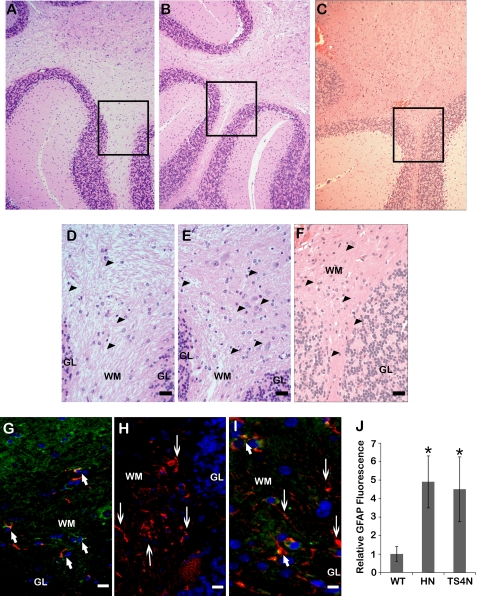
The matricellular SPARC family member hevin (SPARC-like 1/SPARCL-1/SC1/Mast9) contributes to neural development and alters tumor progression in a range of mammalian models. The distribution of hevin in mouse tissues was reexamined with a novel monoclonal antibody that discriminates between hevin and its ortholog SPARC. We now report proteolysis of hevin in many tissues, with the most extensive processing in the brain. We demonstrate a cleavage site within the hevin sequence for the neural tissue proteinase ADAMTS4. Digestion of hevin by ADAMTS4 in vitro produced fragments similar to those present in brain lysates. Monoclonal antibodies revealed a SPARC-like fragment generated from hevin that was co-localized with ADAMTS4 in vivo. We show that proteolysis of hevin by ADAMTS4 in the mouse cerebellum is important for the normal development of this tissue. In conclusion, we have identified the fragmentation of hevin by ADAMTS4 in the mouse brain and propose that this specific proteolysis is integral to cell morphology and extracellular matrix deposition in the developing brain.


Figures

FIGURE 1.
FIGURE 1.
Proteolysis of hevin in mouse tissues and predicted cleavage by ADAMTS4. A, protein from tissue lysates was resolved by SDS-PAGE, immunoblotted, and probed with anti-hevin antibodies. Equal amounts of total protein were added to each lane. Arrowhead, intact hevin; small arrows and asterisk, major cleavage products of hevin. Glyceraldehyde-3-phosphate dehydrogenase (GAPDH) was used as a loading control. Lanes: 1, adrenal gland; 2, brain; 3, eye; 4, heart; 5, lacrimal gland; 6, lung; 7, pancreas. Results shown are from the same gel (equal exposure times) and are representative of at least three independent experiments. Molecular masses (in kDa) are indicated on the left. B, a single predicted cleavage site was identified in the sequence for ADAMTS4 (indicated by the arrowhead and blue coloring). Red indicates regions of homology between hevin and SPARC. C, diagram indicates the position of the cleavage site in hevin (arrowhead) relative to SPARC.
FIGURE 2.
FIGURE 2.
Cleavage of hevin in vitro by ADAMTS4. Hevin and ADAMTS4 were co-expressed by transfection of HEK 293 cells (A), or the recombinant proteins were incubated together for the time intervals indicated (B). A, shown is an immunoblot of conditioned media from single- or co-transfected HEK 293 cells probed with polyclonal rabbit anti-hevin or anti-ADAMTS4 IgG on two separate gels run in parallel. Lanes: 1, recombinant hevin; 2, mock-transfected conditioned media; 3, hevin-transfected conditioned media; 4, ADAMTS4-transfected conditioned media; 5, hevin/ADAMTS4 co-transfected conditioned media. B, a 10% SDS-polyacrylamide gel stained with Coomassie Blue shows proteolysis of hevin by ADAMTS4 as a function of time. Arrowheads (A and B) indicate intact hevin. Arrows (A and B) indicate major peptides corresponding in size to the C-terminal peptide predicted by the ADAMTS4 cleavage site in Fig. 1. Molecular masses (in kDa) are indicated on the left.
FIGURE 3.
FIGURE 3.
Monoclonal antibodies identify hevin fragments. Stocks of hybridoma-conditioned media were used to identify clones that react with full-length hevin and hevin-derived peptides. ELISA and immunoblotting were performed with full-length hevin, a recombinant SLF mimicking a major fragment from proteolysis, and a recombinant C-terminal peptide (C-term). Polyclonal goat anti-hevin IgG and the previously described rat monoclonal antibody 12-155 were used as positive and negative controls, respectively. A, shown are sizes and N termini of the SLF (arrow) and C-terminal peptide (arrowhead) relative to full-length hevin. B, shown are ELISA and an immunoblot comparing reactivity of polyclonal goat anti-hevin IgG with recombinant hevin (rHevin) and hevin peptides. C, shown are ELISA and immunoblot comparing the reactivity of monoclonal rat antibody 12-155 with recombinant hevin and hevin peptides. D, shown are ELISA and an immunoblot comparing the reactivity of monoclonal rat antibody 12-54 with recombinant hevin and hevin peptides. Equivalent molar concentrations of proteins were added to each lane for SDS-PAGE and immunoblotting. Lanes 1 and the asterisk, full-length hevin; lanes 2 and arrows, SLF; lane 3 and arrowhead, C-terminal peptide. Abs, absorbance.
FIGURE 4.
FIGURE 4.
ADAMTS4 appears coincident with hevin in the mouse brain. Immunohistochemical staining was performed on the Purkinje cell layer (A and B) and white matter (C and D) of serially sectioned WT (+/+) (A and C) and ADAMTS4-null (−/−) (B and D) paraffin-embedded mouse brain. Sections were co-stained with polyclonal rabbit anti-ADAMTS4 (green) and polyclonal goat anti-hevin antibodies (red). Yellow indicates coincidence of ADAMTS4 and hevin. E, immunoblotting of active ADAMTS4 (∼68 kDa) in lysates from WT and ADAMTS4-null cerebellum. Glyceraldehyde-3-phosphate dehydrogenase (GAPDH) was used as a loading control. Lane 1, recombinant ADAMTS4; lane 2, WT brain lysate; lane 3, ADAMTS4-null brain lysate. Results shown are from the same gel (equal exposure times) and are representative of at least three independent experiments. Scale bar, 1 μm.
FIGURE 5.
FIGURE 5.
Proteolysis of hevin in the brain is dependent on ADAMTS4. Immunohistochemical staining was performed on the Purkinje cell layer of serially sectioned WT (A–C) and ADAMTS4-null (D–F) mouse brain. Sections were stained with polyclonal goat anti-hevin IgG (Poly) (A and D), monoclonal rat antibody 12-155 (155) (B and E), or monoclonal rat antibody 12-54 (54) (C and F). Peptide-specific staining observed in WT brain (green) (C) is absent in ADAMTS4-null brain (F). Images are representative of staining patterns seen in three independent experiments. Scale bar, 10 μm. G, immunoblotting was performed on cerebellar lysates from WT, hevin-null, and ADAMTS4-null animals. Blots were probed with polyclonal goat anti-hevin IgG (Poly), monoclonal rat antibody 12-155 (155), or monoclonal rat antibody 12-54 (54). Glyceraldehyde-3-phosphate dehydrogenase (GAPDH) was used as a loading control. Lanes: 1, WT brain; 2, hevin-null brain; 3, ADAMTS4-null brain. The arrowhead indicates intact hevin. The arrow indicates major peptides corresponding in size to the C-terminal peptide predicted by the ADAMTS4 cleavage site in Fig. 2. Molecular masses (in kDa) are indicated on the left.
FIGURE 6.
FIGURE 6.
Absence of hevin fragments affects Purkinje cell morphology in the mouse cerebellum. A, H+E-stained mouse brain showing a representative section that was stained in experiments detailed below. The box highlights the image magnified in panel B. Ob, olfactory bulb; Hyp, hypothalamus; Cor, cortex; Hip, hippocampus; Cb, cerebellum; PM, pons-medulla. Scale bar, 240 μm. B, shown is a magnified image of a H+E section of mouse cerebellum. The box indicates a representative area of cerebellum stained for all subsequent analyses of all genotypes. Scale bar, 60 μm. Immunohistochemical staining was performed on the Purkinje cell layer of serially sectioned WT (C and F), hevin-null (D and G), and ADAMTS4-null (E and H) mouse brains. Sections were stained with anti-calbindin (green). Altered morphology of Purkinje cell dendritic processes (arrows) is apparent in hevin-null and ADAMTS4-null tissue. Images are representative of staining patterns seen in three independent experiments. PC, Purkinje cell. Scale bar, 1 μm.
FIGURE 7.
FIGURE 7.
Decreased expression or cleavage of hevin promotes gliosis in the mouse cerebellum. Immunohistochemical and H+E staining were performed on serially sectioned WT (A, D, and G), hevin-null (B, E, and H), or ADAMTS4-null (C, F, and I) mouse cerebellum. Areas of higher magnification stained with H+E (D–F) are indicated by boxes in A–C. In D–F, astrocyte/microglial cells are indicated by arrowheads. For immunohistochemistry (G–I), sections were co-stained with polyclonal goat anti-hevin (green) and polyclonal rabbit anti-GFAP antibodies (red). Arrows indicate GFAP+/hevin+ cells (short arrows) and areas of increased GFAP without hevin expression (long arrows). Images are representative of staining patterns seen in three independent experiments. WM, white matter; GL, granular layer. Scale bar, 40 μm (A–C) and 10 μm (D–I). J, quantification of total GFAP staining from a minimum of 6 fields per genotype is shown. Increased GFAP signal is evident in the white matter of hevin-null (HN) and ADAMTS4-null (TS4N) tissue, relative to WT brain (*, p < 0.05).

Similar articles

Cited by

References

    1. Bornstein P., Sage E. H. (2002) Curr. Opin. Cell Biol. 14, 608–616 - PubMed
    1. Brekken R. A., Sage E. H. (2001) Matrix Biol. 19, 816–827 - PubMed
    1. Girard J. P., Springer T. A. (1995) Immunity 2, 113–123 - PubMed
    1. Lively S., Ringuette M. J., Brown I. R. (2007) Neurochem. Res. 32, 65–71 - PubMed
    1. Lively S., Brown I. R. (2008) Neurochem. Res. 33, 1692–1700 - PubMed

Publication types

MeSH terms