. 2010 Feb 12;285(7):4415-22.
doi: 10.1074/jbc.M109.085431. Epub 2009 Dec 15.

MicroRNAs regulate human hepatocyte nuclear factor 4alpha, modulating the expression of metabolic enzymes and cell cycle

Affiliations

MicroRNAs regulate human hepatocyte nuclear factor 4alpha, modulating the expression of metabolic enzymes and cell cycle

Shingo Takagi et al. J Biol Chem. .

Abstract

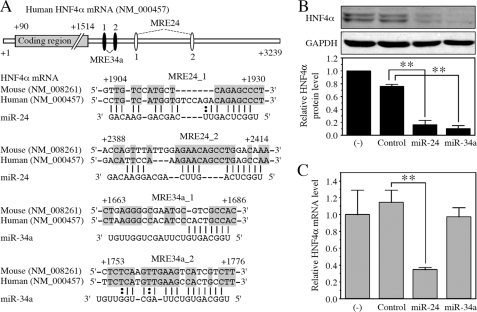
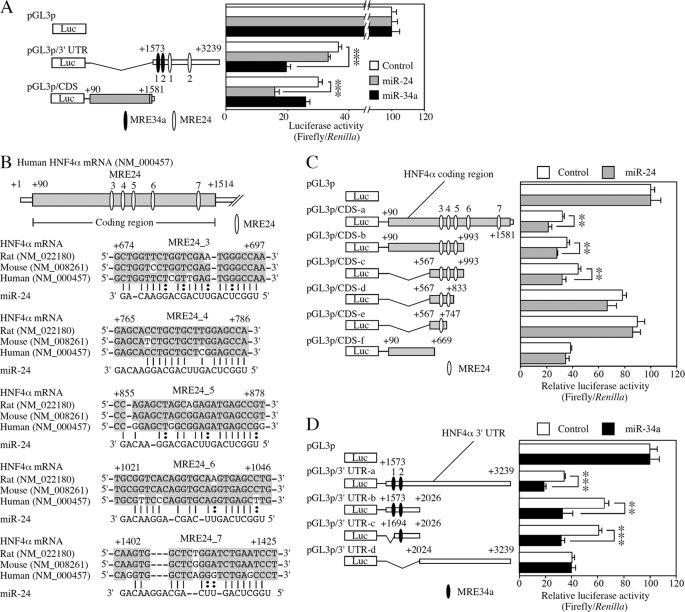
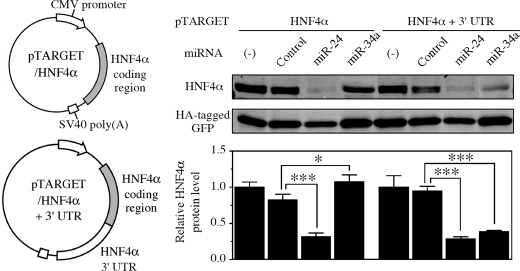
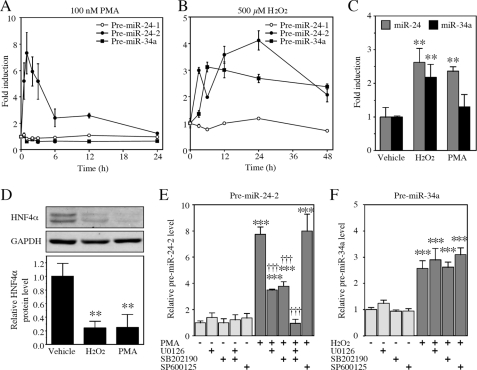
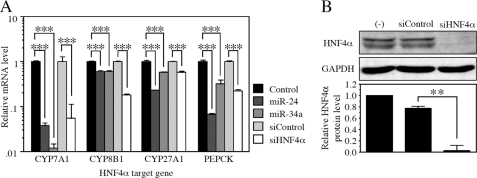
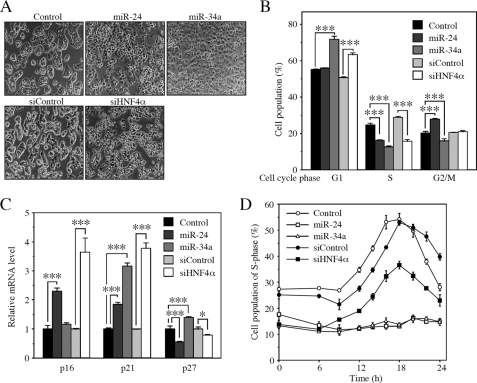
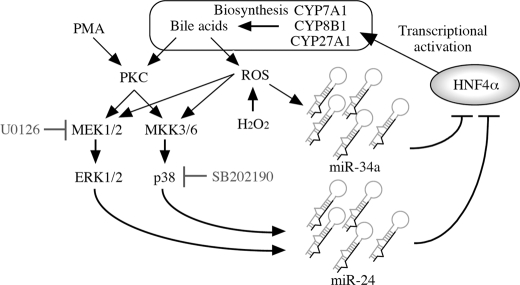
Hepatocyte nuclear factor (HNF) 4alpha is a key transcription factor regulating endo/xenobiotic-metabolizing enzymes and transporters. We investigated whether microRNAs are involved in the regulation of human HNF4alpha. Potential recognition elements for miR-24 (MRE24) were identified in the coding region and the 3'-untranslated region (3'-UTR), and those for miR-34a (MRE34a) were identified in the 3'-UTR in HNF4alpha mRNA. The HNF4alpha protein level in HepG2 cells was markedly decreased by the overexpression of miR-24 and miR-34a. The HNF4alpha mRNA level was significantly decreased by the overexpression of miR-24 but not by miR-34a. In luciferase analyses in HEK293 cells, the reporter activity of plasmid containing the 3'-UTR of HNF4alpha was significantly decreased by miR-34a. The reporter activity of plasmid containing the HNF4alpha coding region downstream of the luciferase gene was significantly decreased by miR-24. These results suggest that the MRE24 in the coding region and MRE34a in the 3'-UTR are functional in the negative regulation by mRNA degradation and translational repression, respectively. The down-regulation of HNF4alpha by these microRNAs resulted in the decrease of various target genes such as cytochrome P450 7A1 and 8B1 as well as morphological changes and the decrease of the S phase population in HepG2 cells. We also clarified that the expressions of miR-24 and miR-34a were regulated by protein kinase C/mitogen-activated protein kinase and reactive oxygen species pathways, respectively. In conclusion, we found that human HNF4alpha was down-regulated by miR-24 and miR-34a, the expression of which are regulated by cellular stress, affecting the metabolism and cellular biology.


Figures

FIGURE 1.
FIGURE 1.
The potential MREs in the 3′-UTR of HNF4α mRNA and the effects of miR-24 and miR-34a on the HNF4α level. A, schematic diagrams of human HNF4α mRNA and the predicted target sites of miR-24 and miR-34a in the 3′-UTR are shown (upper panel). The numbering refers to the 5′ end of mRNA as 1. Complementarity of miR-24 and miR-34a to the predicted target sequence of human HNF4α is shown (lower panel). The conserved nucleotides are highlighted in gray boxes. B and C, pre-miR miRNA precursor molecules were transfected into HepG2 cells at a concentration of 50 nm. After 48 h, total RNA and whole cell lysates were prepared. The HNF4α and GAPDH protein levels were determined by Western blot analyses (B). The HNF4α mRNA levels were determined by real time RT-PCR and normalized with the GAPDH mRNA level (C). The data are relative to no transfection (−). Each column represents the mean ± S.D. of three independent experiments. **, p < 0.01.
FIGURE 2.
FIGURE 2.
Reporter analyses of MREs in the coding region and 3′-UTR of HNF4α mRNA. A, reporter plasmids and pre-miR miRNA precursor molecules were co-transfected into HEK293 cells, and luciferase assays were performed after 48 h. The data were the firefly luciferase activities normalized with the Renilla luciferase activities relative to that of pGL3p co-transfected with each miRNA. Each column represents the mean ± S.D. of three independent experiments. ***, p < 0.001. B, schematic diagrams of the coding region of human HNF4α mRNA and mapping of predicted miR-24 target sites are described. Complementarity of miR-24 to the predicted target sequence of human HNF4α is also indicated. The conserved nucleotides are highlighted in gray boxes. C and D, luciferase assays were performed using plasmids containing MRE24 in the coding region (C) or MRE34a in the 3′-UTR (D) of HNF4α mRNA. The data were relative to that of pGL3p co-transfected with each miRNA. Each column represents the mean ± S.D. of three independent experiments. **, p < 0.01; ***, p < 0.001.
FIGURE 3.
FIGURE 3.
Effects of miRNAs on the exogenous HNF4α expression in HEK293 cells. The HNF4α expression plasmids including and excluding 3′-UTR used in this study are shown. These plasmids were transfected with HA-tagged GFP expression plasmid and pre-miR miRNA precursor molecules into HEK293 cells. After 48 h, whole cell lysates were prepared. The exogenously expressed HNF4α and HA-tagged GFP protein levels were determined by Western blot analyses. The data represent HNF4α protein level normalized with HA-tagged GFP level relative to that of no transfection (−). Each column represents the mean ± S.D. of three independent experiments. *, p < 0.05; ***, p < 0.001.
FIGURE 4.
FIGURE 4.
Regulation of miR-24 and miR-34a through MAPK and ROS pathway, respectively. A and B, HepG2 cells were treated with 100 nm PMA (A) or 500 μm H2O2 (B) for the indicated time. The pre-miRNA levels were determined by real time RT-PCR and normalized with the U6 small nuclear RNA level. The data are shown as fold changes compared with vehicle. Each point represents the mean ± S.D. of three independent experiments. C and D, HepG2 cells were treated with 100 nm PMA or 500 μm H2O2 for 48 h. The mature miR-24 and miR-34a levels were determined by real time RT-PCR and normalized with the U6 small nuclear RNA level (C). The HNF4α and GAPDH protein levels were determined by Western blot analyses (D). The data are relative to vehicle. Each column represents the mean ± S.D. of three independent experiments. **, p < 0.01, compared with vehicle. E and F, cells were co-treated with 100 nm PMA and 10 μm MAPK inhibitors for 1 h (E) or co-treated with 500 μm H2O2 and 10 μm MAPK inhibitors for 6 h (F). Each column represents the mean ± S.D. of three independent experiments. ***, p < 0.001, compared with nontreatment; †††, p < 0.001, compared with PMA-treated.
FIGURE 5.
FIGURE 5.
Down-regulation of various HNF4α target genes by miR-24 and miR-34a as well as siHNF4α. A, the mRNA levels of various targets of HNF4α in HepG2 cells were examined by real time RT-PCR and normalized with the GAPDH mRNA level. The data are relative to that transfected with control or siControl. Each column represents the mean ± S.D. of three independent experiments. ***, p < 0.001. B, the HNF4α and GAPDH protein levels in HepG2 cells were determined by Western blot analyses. The data are relative to no transfection (−). Each column represents the mean ± S.D. of three independent experiments. **, p < 0.01.
FIGURE 6.
FIGURE 6.
Inhibition of G1/S transition by miR-24 and miR-34a in HepG2 cells. A, morphological change of HepG2 cells at 72 h after the transfection with pre-miRNA precursor molecules or siRNAs was visualized and photographed under a light microscope. B, cells were collected at 48 h after the transfection, and the cell population in each phase of cell cycle was analyzed by FACS. Each column represents the mean ± S.D. of three independent experiments. ***, p < 0.001. C, the p16, p21, and p27 mRNA levels were determined by real time RT-PCR and were normalized with the GAPDH mRNA level. The data are relative to that transfected with the control or siControl. Each column represents the mean ± S.D. of three independent experiments. *, p < 0.05; ***, p < 0.001. D, the time-dependent change of the percentages of cell population under S phase are shown. Twenty-four hours after the transfection with pre-miRNA precursor molecules or siRNAs, the cells were synchronized by serum deprivation for 24 h. Then the cells were restimulated with serum for the indicated time. Each point represents the mean ± S.D. of three independent experiments.
FIGURE 7.
FIGURE 7.
A proposal of the regulatory loop of miR-24, miR-34a, and HNF4α in bile acid synthesis. Bile acids are known to activate PKC and ROS generation, resulting in the activation of MAPK pathway. The miR-24 and miR-34a expression are induced by MAPK-dependent and -independent pathways, respectively. In turn, miR-24 and miR-34a negatively regulate the HNF4α. The down-regulation of HNF4α decreases the expression of bile acid-synthesizing enzymes CYP7A1 and CYP8B1, resulting in the decrease of bile acids.

Similar articles

Cited by

References

    1. Gonzalez F. J. (2008) Drug Metab. Pharmacokinet. 23, 2–7 - PubMed
    1. Kamiyama Y., Matsubara T., Yoshinari K., Nagata K., Kamimura H., Yamazoe Y. (2007) Drug Metab. Pharmacokinet. 22, 287–298 - PubMed
    1. Hylemon P. B., Zhou H., Pandak W. M., Ren S., Gil G., Dent P. (2009) J. Lipid Res. 50, 1509–1520 - PMC - PubMed
    1. Goodwin B., Jones S. A., Price R. R., Watson M. A., McKee D. D., Moore L. B., Galardi C., Wilson J. G., Lewis M. C., Roth M. E., Maloney P. R., Willson T. M., Kliewer S. A. (2000) Mol. Cell 6, 517–526 - PubMed
    1. Lee Y. K., Dell H., Dowhan D. H., Hadzopoulou-Cladaras M., Moore D. D. (2000) Mol. Cell. Biol. 20, 187–195 - PMC - PubMed

Publication types

MeSH terms