. 2010 Feb 25;115(8):1534-44.
doi: 10.1182/blood-2009-04-215855. Epub 2009 Dec 17.

A highly efficient short hairpin RNA potently down-regulates CCR5 expression in systemic lymphoid organs in the hu-BLT mouse model

Affiliations

A highly efficient short hairpin RNA potently down-regulates CCR5 expression in systemic lymphoid organs in the hu-BLT mouse model

Saki Shimizu et al. Blood. .

Abstract

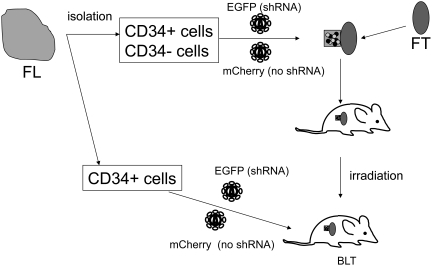
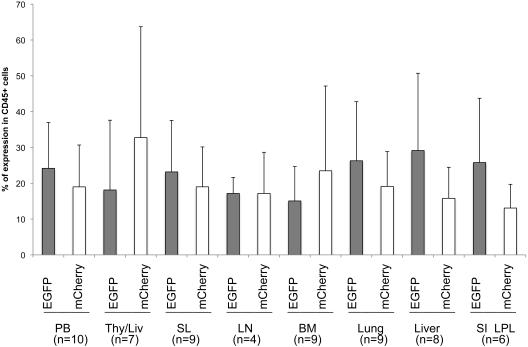
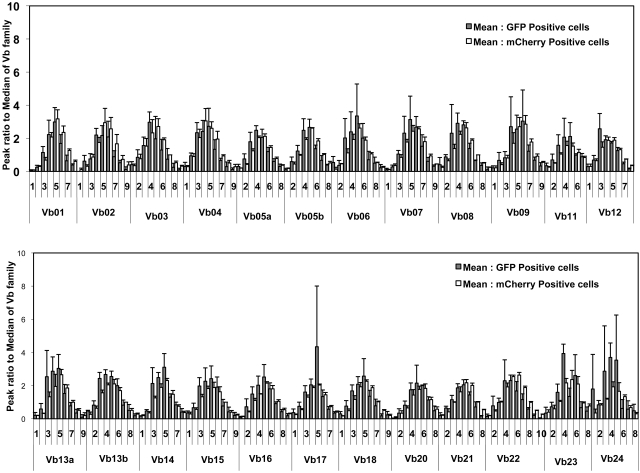
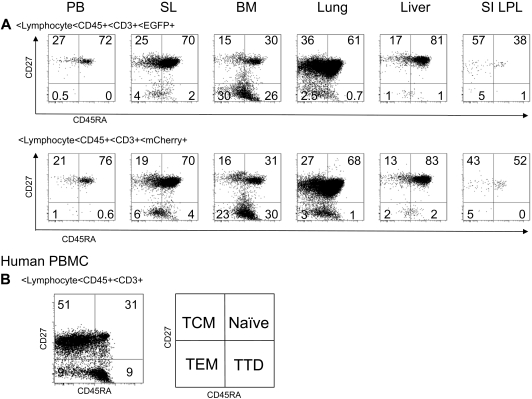
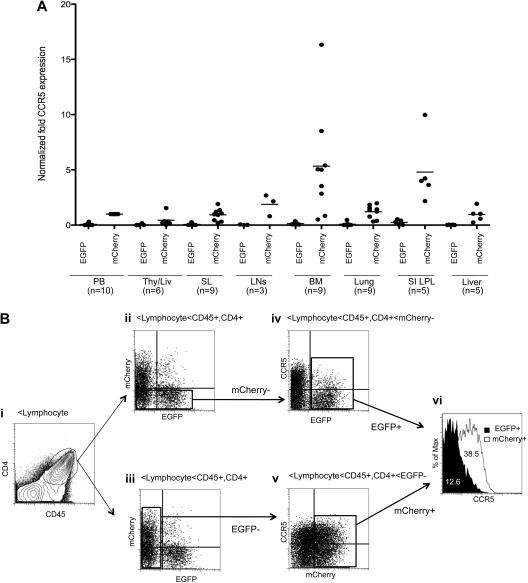
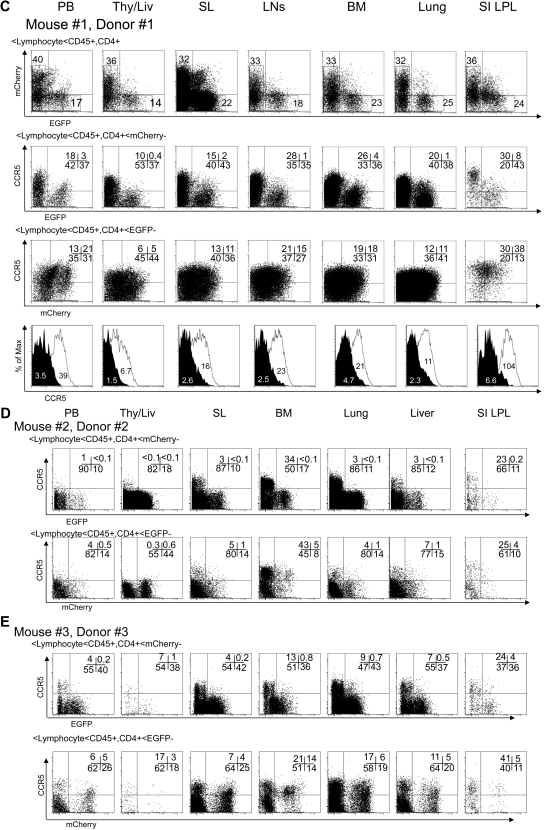
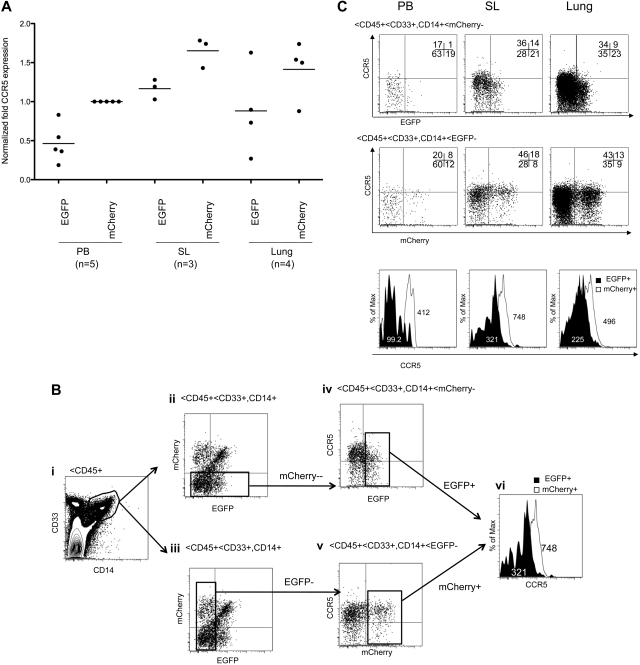
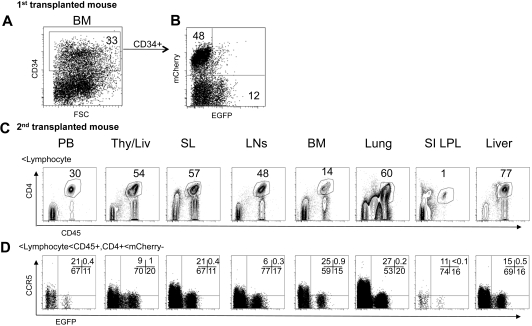
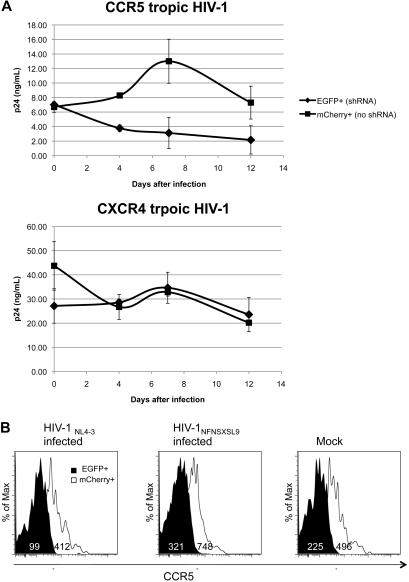
Inhibiting the expression of the HIV-1 coreceptor CCR5 holds great promise for controlling HIV-1 infection in patients. Here we report stable knockdown of human CCR5 by a short hairpin RNA (shRNA) in a humanized bone marrow/liver/thymus (BLT) mouse model. We delivered a potent shRNA against CCR5 into human fetal liver-derived CD34(+) hematopoietic progenitor/stem cells (HPSCs) by lentiviral vector transduction. We transplanted vector-transduced HPSCs solidified with Matrigel and a thymus segment under the mouse kidney capsule. Vector-transduced autologous CD34(+) cells were subsequently injected in the irradiated mouse, intended to create systemic reconstitution. CCR5 expression was down-regulated in human T cells and monocytes/macrophages in systemic lymphoid tissues, including gut-associated lymphoid tissue, the major site of HIV-1 replication. The shRNA-mediated CCR5 knockdown had no apparent adverse effects on T-cell development as assessed by polyclonal T-cell receptor Vbeta family development and naive/memory T-cell differentiation. CCR5 knockdown in the secondary transplanted mice suggested the potential of long-term hematopoietic reconstitution by the shRNA-transduced HPSCs. CCR5 tropic HIV-1 infection was effectively inhibited in mouse-derived human splenocytes ex vivo. These results demonstrate that lentiviral vector delivery of shRNA into human HPSCs could stably down-regulate CCR5 in systemic lymphoid organs in vivo.


Figures

Figure 1
Figure 1
Diagram of generating a lentiviral vector–transduced HPSC-transplanted hu-BLT mouse. CD34+ and CD34 cells isolated from a human fetal liver were transduced by either shRNA (EGFP+) or no shRNA (mCherry+) vectors. The transduced cells were solidified with Matrigel and implanted under a kidney capsule with a piece of human fetal thymus. Three weeks after the implantation, the mouse was irradiated and intravenously injected with vector-transduced autologous CD34+ cells. FL indicates human fetal liver segment; and FT, human fetal thymus segment.
Figure 2
Figure 2
Human hematopoietic differentiation of shRNA 1005-transduced HPSCs in multiple lymphoid organs. EGFP and mCherry reporter gene expression was examined in human CD45+ cells in gated lymphocyte population in multiple tissues. Samples were analyzed between 14 and 20 weeks after intravenous CD34+ cell injection. Mean percentage EGFP and percentage mCherry expression are shown in each organ. No significant difference was found (P > .05) between percentage EGFP+ and percentage mCherry+ cells in various tissues by Student t test. Data were generated from n = 4 to 10 individual animals from an aggregate of 8 donors. Error bar represents SD. PB indicates peripheral blood; Thy/Liv, transplanted human thy/liv organoid; BM, bone marrow; SL, spleen; LN, lymph nodes; SI LPL, small intestine lamina propria lymphocytes; and n, number of samples.
Figure 3
Figure 3
Polyclonal human TCRvβ development in thymocytes differentiated from shRNA 1005-transduced HPSCs. Total RNA isolated from FACS-purified EGFP+ or mCherry+ thymocytes taken from thy/liv organoids of 3 reconstituted BLT mice were subjected to a quantitative PCR-based TCR spectratyping analysis. Peak ratio was compared with the median of each TCR Vβ family between EGFP+ and mCherry+ thymocytes. There was no significant difference between the 2 groups (P = .668, by Mann-Whitney test). TCRs are made from splicing of V-D-J regions, and the complementarity determining region-3 region is therefore random in size. Thus, the PCR output bands corresponding to different sized splice products, and the intensity of these bands should be Gaussian in distribution if T-cell repertoires are random.
Figure 4
Figure 4
Naive and memory T-cell differentiation of shRNA 1005-expressing T cells. (A) Naive and memory T-cell differentiation was analyzed by CD27 and CD45RA cell surface expression in gated EGFP+ and mCherry+ CD3+ T lymphocytes from multiple lymphoid organs. (B) A normal human peripheral blood mononuclear cell staining control is shown as a control. TCM indicates central memory T cells; TEM, effector memory T cells; and TTD, terminally differentiated cells.
Figure 5
Figure 5
Efficient CCR5 down-regulation in human CD4+ T lymphocytes in multiple lymphoid organs. (A) The level of CCR5 expression was compared in EGFP+ and mCherry+ human CD4+/CD45+ lymphocytes in lymphoid tissues from multiple transplanted mice. We normalized CCR5 expression level using the mean CCR5 expression in mCherry+ cells from peripheral blood (PB) as 1. Samples were obtained between 14 and 20 weeks after intravenous CD34+ cell injection. Bar represents mean value; n indicates number of samples. Aggregate difference, comparing CCR5 expression in EGFP+ versus mCherry+ cells in all tissues, was statistically significant by Student t test (P < .001). (B) A representative gating scheme. (i) The human CD4+/CD45+ population was identified in the gated lymphocyte population in spleen. (ii-iii) EGFP and mCherry expression was identified in the CD4+/CD45+ gated population. (iv) mCherry population was further gated to analyze CCR5 expression in EGFP+ and EGFP population. (v) EGFP population was further gated to analyze CCR5 expression in mCherry+ and mCherry population. (vi) The mean fluorescent intensity of CCR5 expression was compared in EGFP+ and mCherry+ population. (C-D) Representative data showing CCR5 down-regulation in multiple lymphoid tissues from a mouse with the highest CCR5 basal expression. (E) Additional dataset from mouse reconstituted with different donor. Data were analyzed as shown in panel B.
Figure 5
Figure 5
Efficient CCR5 down-regulation in human CD4+ T lymphocytes in multiple lymphoid organs. (A) The level of CCR5 expression was compared in EGFP+ and mCherry+ human CD4+/CD45+ lymphocytes in lymphoid tissues from multiple transplanted mice. We normalized CCR5 expression level using the mean CCR5 expression in mCherry+ cells from peripheral blood (PB) as 1. Samples were obtained between 14 and 20 weeks after intravenous CD34+ cell injection. Bar represents mean value; n indicates number of samples. Aggregate difference, comparing CCR5 expression in EGFP+ versus mCherry+ cells in all tissues, was statistically significant by Student t test (P < .001). (B) A representative gating scheme. (i) The human CD4+/CD45+ population was identified in the gated lymphocyte population in spleen. (ii-iii) EGFP and mCherry expression was identified in the CD4+/CD45+ gated population. (iv) mCherry population was further gated to analyze CCR5 expression in EGFP+ and EGFP population. (v) EGFP population was further gated to analyze CCR5 expression in mCherry+ and mCherry population. (vi) The mean fluorescent intensity of CCR5 expression was compared in EGFP+ and mCherry+ population. (C-D) Representative data showing CCR5 down-regulation in multiple lymphoid tissues from a mouse with the highest CCR5 basal expression. (E) Additional dataset from mouse reconstituted with different donor. Data were analyzed as shown in panel B.
Figure 6
Figure 6
CCR5 down-regulation in EGFP-expressing human monocyte/macrophage population in multiple lymphoid organs. (A) Normalized mean CCR5 expression was compared in EGFP+ and mCherry+ human CD14+/CD33+ monocyte/macrophage population in multiple tissues. Bar represents mean value. Samples were analyzed between 14 and 20 weeks after intravenous CD34+ cell injection. Aggregate difference, comparing CCR5 expression in EGFP+ versus mCherry+ cells in all tissues, was statistically significant by Student t test (P < .001). (B) Gating strategies are the same as shown in Figure 5B except for the use of CD14 and CD33 markers. (C) Representative data showing CCR5 expression in CD14+/CD33+ monocyte/macrophage population.
Figure 7
Figure 7
CCR5 down-regulation in second transplanted mice. The bone marrow cells from an EGFP- and mCherry-expressing transplanted donor mouse were isolated and analyzed for CD34 (A) and EGFP and mCherry expression (B). (C-D) Bone marrow cells were directly injected into a thy/liv tissue and intravenously in irradiated recipient mice (n = 2). (C) Human CD4+/CD45+ population was identified in gated lymphocyte population in multiple tissues 14 weeks after bone marrow cell injection. (D) CCR5 expression in EGFP+ and EGFP population was examined in the gated mCherry/CD4+/CD45+ population. Data from a representative mouse are shown.
Figure 8
Figure 8
CCR5 tropic HIV-1 inhibition ex vivo. (A) Splenocytes were isolated from a transplanted mouse at 20 weeks after CD34+ cell injection. Cells were activated with PHA for 2 days and interleukin-2 for 5 days. CD8+ cells were depleted and sorted for EGFP+ and mCherry+ cells at 99.6% purities. Sorted cells (4 × 10⁴) were infected with CCR5 tropic HIV-1NFNSX SL9 or CXCR4 tropic HIV-1NL4-3 for 2 hours at MOI of 2.5 in parallel and in triplicate. Cells were washed 3 times after the infection. The amount of remaining input HIV-1 particles in culture supernatant was monitored 1 hour after infection by HIV p24 enzyme-linked immunosorbent assay. The amount of HIV production in culture supernatant was monitored by HIV p24 enzyme-linked immunosorbent assay at days 4, 7, and 12 after infection during the culture. The average p24 production in culture supernatant. Error bar represents SD. shRNA significantly affected HIV growth curve of HIV-1NFNSX SL9 but not HIV-1NL4-3 (P < .001 and P = .38, respectively, 2-way analysis of variance). (B) CCR5 expression in EGFP+ and mCherry+ cells at 12 days after HIV-1 infection.

Similar articles

Cited by

References

    1. Moore JP, Trkola A, Dragic T. Co-receptors for HIV-1 entry. Curr Opin Immunol. 1997;9(4):551–562. - PubMed
    1. Berger EA, Murphy PM, Farber JM. Chemokine receptors as HIV-1 coreceptors: roles in viral entry, tropism, and disease. Annu Rev Immunol. 1999;17:657–700. - PubMed
    1. Mosier DE. Virus and target cell evolution in human immunodeficiency virus type 1 infection. Immunol Res. 2000;21(2):253–258. - PubMed
    1. Simmons G, Reeves JD, Hibbitts S, et al. Co-receptor use by HIV and inhibition of HIV infection by chemokine receptor ligands. Immunol Rev. 2000;177:112–126. - PubMed
    1. Ioannidis JP, Rosenberg PS, Goedert JJ, et al. Effects of CCR5-Delta32, CCR2-64I, and SDF-1 3′A alleles on HIV-1 disease progression: an international meta-analysis of individual-patient data. Ann Intern Med. 2001;135(9):782–795. - PubMed

Publication types

MeSH terms

Substances