. 2010 May;9(5):780-90.
doi: 10.1074/mcp.M900452-MCP200. Epub 2009 Dec 17.

A robust error model for iTRAQ quantification reveals divergent signaling between oncogenic FLT3 mutants in acute myeloid leukemia

Affiliations

A robust error model for iTRAQ quantification reveals divergent signaling between oncogenic FLT3 mutants in acute myeloid leukemia

Yi Zhang et al. Mol Cell Proteomics. 2010 May.

Abstract

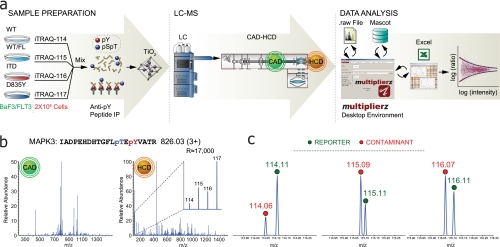
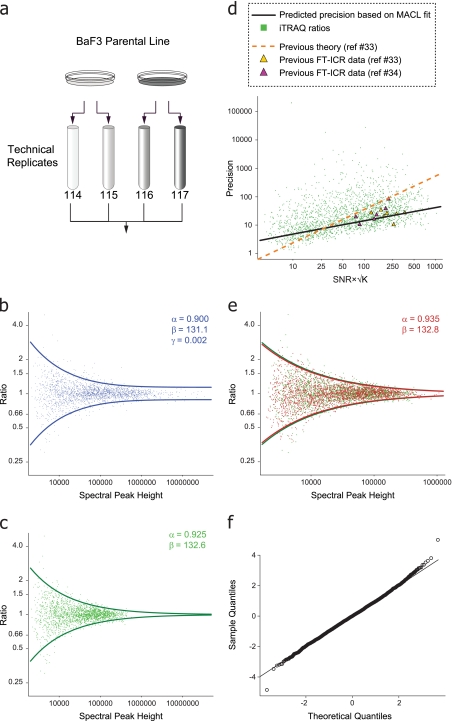
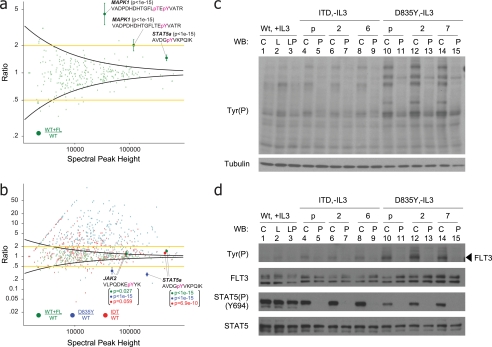
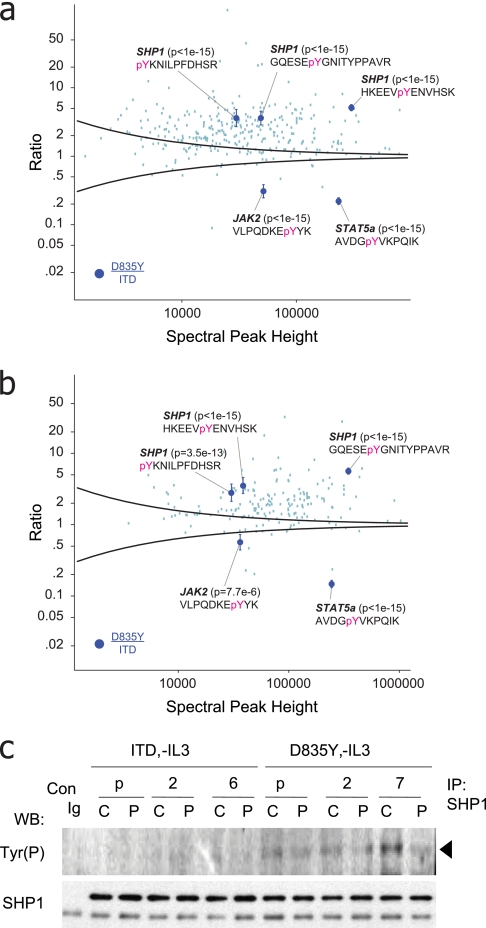
The FLT3 receptor tyrosine kinase plays an important role in normal hematopoietic development and leukemogenesis. Point mutations within the activation loop and in-frame tandem duplications of the juxtamembrane domain represent the most frequent molecular abnormalities observed in acute myeloid leukemia. Interestingly these gain-of-function mutations correlate with different clinical outcomes, suggesting that signals from constitutive FLT3 mutants activate different downstream targets. In principle, mass spectrometry offers a powerful means to quantify protein phosphorylation and identify signaling events associated with constitutively active kinases or other oncogenic events. However, regulation of individual phosphorylation sites presents a challenging case for proteomics studies whereby quantification is based on individual peptides rather than an average across different peptides derived from the same protein. Here we describe a robust experimental framework and associated error model for iTRAQ-based quantification on an Orbitrap mass spectrometer that relates variance of peptide ratios to mass spectral peak height and provides for assignment of p value, q value, and confidence interval to every peptide identification, all based on routine measurements, obviating the need for detailed characterization of individual ion peaks. Moreover, we demonstrate that our model is stable over time and can be applied in a manner directly analogous to ubiquitously used external mass calibration routines. Application of our error model to quantitative proteomics data for FLT3 signaling provides evidence that phosphorylation of tyrosine phosphatase SHP1 abrogates the transformative potential, but not overall kinase activity, of FLT3-D835Y in acute myeloid leukemia.


Figures

Fig. 1.
Fig. 1.
a, analytical work flow for enrichment and analysis of phosphotyrosine-containing peptides from an AML model system with WT and two oncogenic FLT3 mutants (ITD and D835Y). Tryptic peptides from ∼2e6 cells per biological condition were iTRAQ-labeled and subjected to sequential enrichment of phosphotyrosine-containing peptides, first with anti-phosphotyrosine antibodies and then a TiO2 column. Next, LC-MS/MS was performed on an Orbitrap XL using a dual CAD-HCD scan method. Our multiplierz mzAPI-based desktop environment was used for subsequent data analysis. b, CAD and HCD MS/MS spectra of a doubly phosphorylated peptide from MAPK3. iTRAQ reporter ions are not observed in the CAD scan but are among the most intense peaks in the HCD scan. c, high mass resolving power (mm > 15,000) in the low mass region facilitates discrimination of contaminate ions (red circles) from iTRAQ reporters (green circles). IP, immunoprecipitation; pS, phosphoserine; pT, phosphothreonine; pY, phosphotyrosine.
Fig. 2.
Fig. 2.
a, equal aliquots of tryptic peptides derived from murine BaF3 cells were processed as two sets of technical replicates, iTRAQ labeled as indicated, and subjected to LC-MS/MS using a dual scan CAD-HCD method (Fig. 1a). b, a log-log plot of the reporter ion ratios as a function of their geometric mean spectral peak height for technical replicates yielded a best fit curve with constant variance at high signal intensity. c, 95% acceptance region after MACL-based fit to data normalized for linear trap ion injection time. d, precision of the data in c plotted as a function of measured signal-to-noise ratio (SNR) and number of data points, K, across an iTRAQ reporter ion spectral peak (33, 34). Precision based on MACL-derived variance function (Equation 1, black line) and previous theory (33, 34) (dashed orange line) is shown. Experimental data from previous studies are indicated as yellow (33) and purple (34) triangles, respectively. e, data from a biological replicate generated 3 months later and processed as a second set of technical replicates (red) were generated as described above and overlaid with the corrected data in c (green). f, Q-Q plot of the data in e after transformation to uniform variance confirmed the approximate normality of error in log intensities.
Fig. 3.
Fig. 3.
a, identification of phosphorylation regulated by WT FLT3 in cells cultured under normal serum conditions. Addition of exogenous FL increases STAT5a phosphorylation (Tyr-694) by only 1.4-fold relative to unstimulated WT FLT3. Yellow lines represent a global 2-fold threshold. Intensity-based variance function, derived from an analysis of technical replicates (black curve and Fig. 2), yields a statistically significant p value (<10e−22) and 95% confidence interval for regulation of Tyr(P)-694 on STAT5a. p values and 95% confidence intervals for phosphorylated peptides from MAPK1 are also shown. b, relative tyrosine phosphorylation levels of WT FLT3 + FL (green), FLT3-ITD (red), and FLT3-D835Y (blue), each normalized against unstimulated WT FLT3. Tyrosine phosphorylation on STAT5a (Tyr-694) and JAK2 (Tyr-1007) is coordinately up-regulated by both FLT3-ITD and stimulated WT FLT3. In contrast, phosphorylation on these sites is diminished in the context of FLT3-D835Y signaling. c, immunoblot of multiple BaF3 clones with anti-Tyr(P) antibody (specific clone or polyclonal) harboring WT FLT3 (lanes 1–3), FLT3-ITD (lanes 4–9), and FLT3-D835Y (lanes 10–15) confirmed data in b that the point mutant exhibited higher kinase activity as compared with WT FLT3 or FLT3-ITD. C, control (no stimulation); L, ligand stimulation at 50 ng/ml for 30 min; P, treatment with PKC412 at 100 nm for 30 min; p, polyclonal (otherwise specific clone designation is listed). d, immunoblot of cells in c with antibodies against phosphotyrosine, total FLT3, phospho-STAT5 (Tyr(P)-694), and total STAT5. Despite the higher constitutive phosphorylation observed for the point mutant, downstream signaling on STAT5 (Tyr(P)-694) is significantly diminished as compared with WT FLT3 and FLT3-ITD. The legend is the same as in c. pT, phosphothreonine; pY, phosphotyrosine; WB, Western blot.
Fig. 4.
Fig. 4.
a and b, relative tyrosine phosphorylation driven by FLT3-D835Y normalized to FLT3-ITD. Intensity-based variance function, based on an analysis of technical replicates (black curve and Fig. 2), provided for identification of statistically significant points of divergent signaling downstream of oncogenic FLT3 mutants. p values and 95% confidence intervals for phosphorylated peptides from STAT5a (Tyr(P)-694), JAK2 (Tyr(P)-1007), and SHP1 (Tyr(P)-276, Tyr(P)-536, and Tyr(P)-564) were illustrated. c, Western blot analysis of SHP1 immunoprecipitates, from multiple BaF3 clones (as in Fig. 3, c and d), probed with anti-Tyr(P) or anti-SHP1 antibodies. Consistent with the proteomics data in a and b, SHP1 tyrosine phosphorylation was elevated in the context of the point mutant as compared with either WT FLT3 or FLT3-ITD. C, control (no stimulation); P, treatment with PKC412 at 100 nm for 30 min; p, polyclonal (otherwise specific clone designation is listed). pY, phosphotyrosine; WB, Western blot; Con, control; IP, immunoprecipitation.

References

    1. Blume-Jensen P., Hunter T. (2001) Oncogenic kinase signalling. Nature 411, 355–365 - PubMed
    1. Schlessinger J. (2000) Cell signaling by receptor tyrosine kinases. Cell 103, 211–225 - PubMed
    1. Gilliland D. G., Griffin J. D. (2002) The roles of FLT3 in hematopoiesis and leukemia. Blood 100, 1532–1542 - PubMed
    1. Small D. (2006) FLT3 mutations: biology and treatment. Hematology Am. Soc. Hematol. Educ. Program 1, 178–184 - PubMed
    1. Knapper S. (2007) FLT3 inhibition in acute myeloid leukaemia. Br. J. Haematol 138, 687–699 - PubMed

Publication types

MeSH terms