

Patellar cartilage: T2 values and morphologic abnormalities at 3.0-T MR imaging in relation to physical activity in asymptomatic subjects from the osteoarthritis initiative
- PMID: 20019141
- PMCID: PMC2809928
- DOI: 10.1148/radiol.09090596
Patellar cartilage: T2 values and morphologic abnormalities at 3.0-T MR imaging in relation to physical activity in asymptomatic subjects from the osteoarthritis initiative
Abstract
Purpose: To study the interrelationship between patella cartilage T2 relaxation time, other knee abnormalities, and physical activity levels in asymptomatic subjects from the Osteoarthritis Initiative (OAI) incidence cohort.
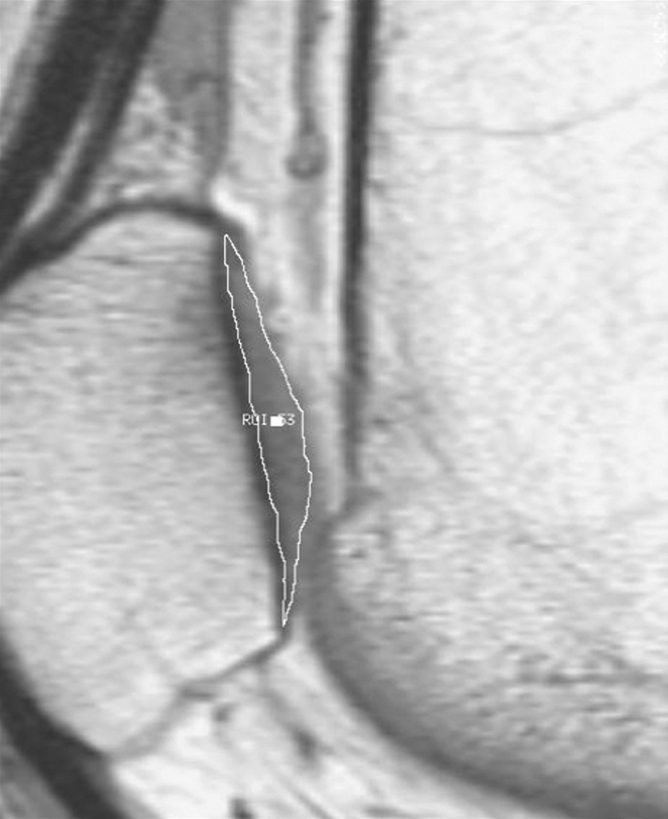
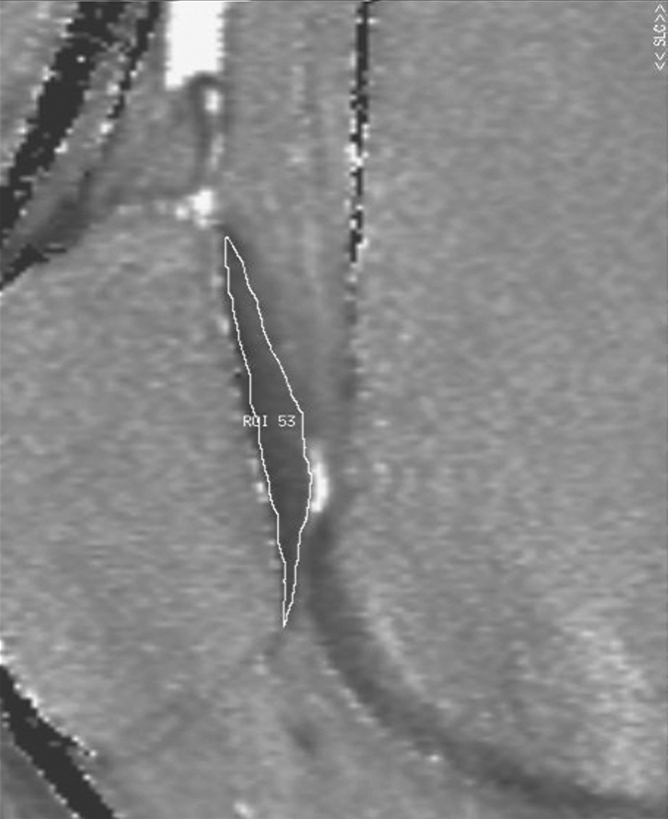
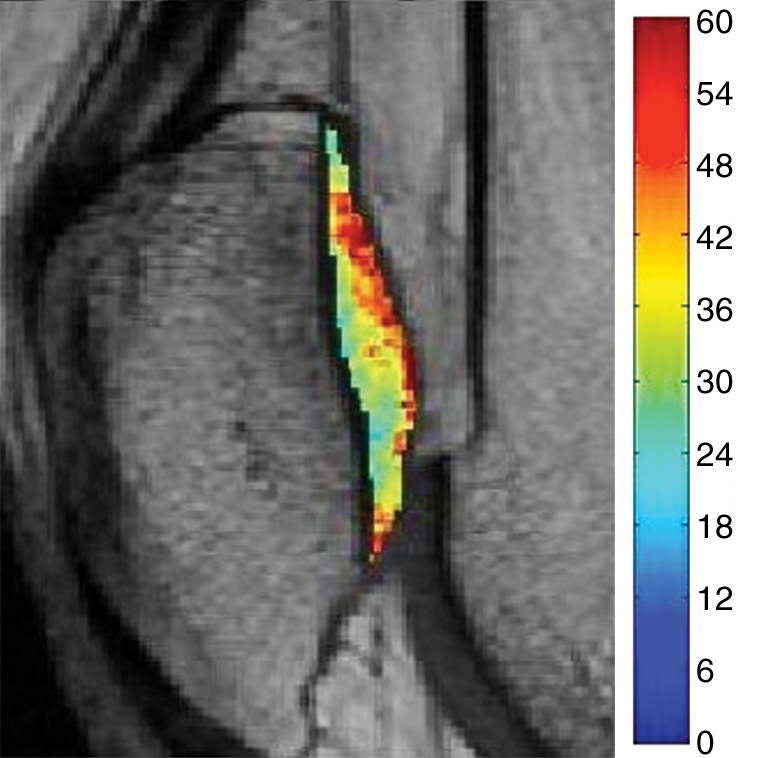
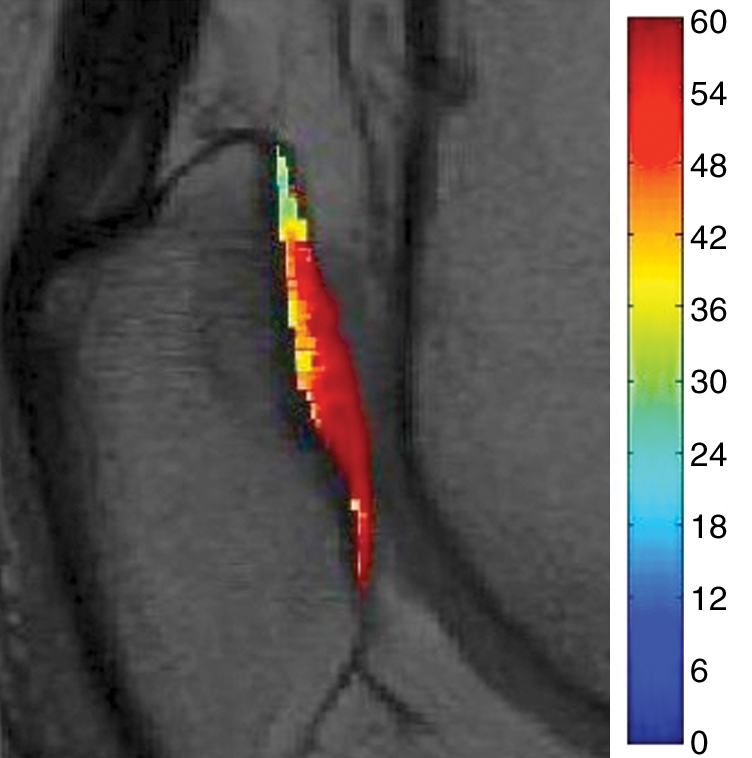
Materials and methods: The study had institutional review board approval and was HIPAA compliant. One hundred twenty subjects from the OAI without knee pain (age, 45-55 years) and with risk factors for knee osteoarthritis (OA) were studied by using knee radiographs, 3.0-T knee magnetic resonance (MR) images (including intermediate-weighted fast spin-echo and T2 mapping sequences), and the Physical Activity Scale for the Elderly. MR images of the right knee were assessed by two musculoskeletal radiologists for the presence and grade of abnormalities. Segmentation of the patella cartilage was performed, and T2 maps were generated. Statistical significance was determined by using analysis of variance, chi(2) analysis, correlation coefficient tests, the Cohen kappa, and a multiple linear regression model.
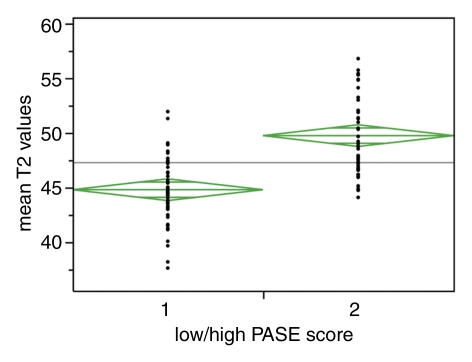
Results: Cartilage lesions were found in 95 (79.0%) of 120 knees, and meniscal lesions were found in 54 (45%) of 120 knees. A significant correlation between patella cartilage T2 values and the severity and grade of cartilage (P = .0025) and meniscus (P = .0067) lesions was demonstrated. Subjects with high activity levels had significantly higher prevalence and grade of abnormalities and higher T2 values (48.7 msec +/-4.35 vs 45.8 msec +/-3.93; P < .001) than did subjects with low activity levels.
Conclusion: Middle-aged asymptomatic individuals with risk factors for knee OA had a high prevalence of cartilage and meniscus knee lesions. Physically active individuals had more knee abnormalities and higher patellar T2 values. Additional studies will be needed to determine causality.
Figures


Similar articles
-
Subjects with higher physical activity levels have more severe focal knee lesions diagnosed with 3T MRI: analysis of a non-symptomatic cohort of the osteoarthritis initiative.Osteoarthritis Cartilage. 2010 Jun;18(6):776-86. doi: 10.1016/j.joca.2010.02.008. Epub 2010 Feb 14. Osteoarthritis Cartilage. 2010. PMID: 20202488 Free PMC article.
-
Knee cartilage T2 characteristics and evolution in relation to morphologic abnormalities detected at 3-T MR imaging: a longitudinal study of the normal control cohort from the Osteoarthritis Initiative.Radiology. 2011 Nov;261(2):507-15. doi: 10.1148/radiol.11102234. Epub 2011 Sep 7. Radiology. 2011. PMID: 21900614 Free PMC article.
-
Texture analysis of cartilage T2 maps: individuals with risk factors for OA have higher and more heterogeneous knee cartilage MR T2 compared to normal controls--data from the osteoarthritis initiative.Arthritis Res Ther. 2011;13(5):R153. doi: 10.1186/ar3469. Epub 2011 Sep 20. Arthritis Res Ther. 2011. PMID: 21933394 Free PMC article. Clinical Trial.
-
Cartilage and meniscal T2 relaxation time as non-invasive biomarker for knee osteoarthritis and cartilage repair procedures.Osteoarthritis Cartilage. 2013 Oct;21(10):1474-84. doi: 10.1016/j.joca.2013.07.012. Epub 2013 Jul 27. Osteoarthritis Cartilage. 2013. PMID: 23896316 Free PMC article. Review.
-
The osteoarthritis initiative: report on the design rationale for the magnetic resonance imaging protocol for the knee.Osteoarthritis Cartilage. 2008 Dec;16(12):1433-41. doi: 10.1016/j.joca.2008.06.016. Epub 2008 Sep 10. Osteoarthritis Cartilage. 2008. PMID: 18786841 Free PMC article. Review.
Cited by
-
Zonal differences in meniscus MR relaxation times in response to in vivo static loading in knee osteoarthritis.J Orthop Res. 2016 Feb;34(2):249-61. doi: 10.1002/jor.23004. Epub 2015 Aug 12. J Orthop Res. 2016. PMID: 26223430 Free PMC article.
-
Obesity increases the prevalence and severity of focal knee abnormalities diagnosed using 3T MRI in middle-aged subjects--data from the Osteoarthritis Initiative.Skeletal Radiol. 2012 Jun;41(6):633-41. doi: 10.1007/s00256-011-1259-3. Epub 2011 Sep 2. Skeletal Radiol. 2012. PMID: 21887596 Free PMC article.
-
The evolution of articular cartilage imaging and its impact on clinical practice.Skeletal Radiol. 2011 Sep;40(9):1197-222. doi: 10.1007/s00256-011-1226-z. Epub 2011 Aug 17. Skeletal Radiol. 2011. PMID: 21847750 Review.
-
Joint Surface Lesions in the Knee Treated with an Acellular Aragonite-Based Scaffold: A 3-Year Follow-Up Case Series.Cartilage. 2021 Dec;13(1_suppl):1217S-1227S. doi: 10.1177/1947603520988164. Epub 2021 Jan 15. Cartilage. 2021. PMID: 33448238 Free PMC article.
-
Vastus lateralis/vastus medialis cross-sectional area ratio impacts presence and degree of knee joint abnormalities and cartilage T2 determined with 3T MRI - an analysis from the incidence cohort of the Osteoarthritis Initiative.Osteoarthritis Cartilage. 2011 Jan;19(1):65-73. doi: 10.1016/j.joca.2010.10.023. Epub 2010 Oct 31. Osteoarthritis Cartilage. 2011. PMID: 21044692 Free PMC article.
References
-
- Lane NE, Thompson JM. Management of osteoarthritis in the primary-care setting: an evidence-based approach to treatment. Am J Med 1997;103:25S–30S - PubMed
-
- Mankin HJ, Brandt KD. Pathogenesis of arthritis In: Kelley WN, Harris ED, Jr, Ruddy S, Clement B. Textbook of rheumatology 4th ed Philadelphia, Pa: Saunders, 1993
-
- Liess C, Lusse S, Karger N, Heller M, Gluer CC. Detection of changes in cartilage water content using MRI T2-mapping in vivo. Osteoarthritis Cartilage 2002;10:907–913 - PubMed
-
- Burstein D, Gray M. New MRI techniques for imaging cartilage. J Bone Joint Surg Am 2003;85-A(suppl 2):70–77 - PubMed
Publication types
MeSH terms
Grants and funding
LinkOut - more resources
Full Text Sources
Medical
