. 2010 Feb;176(2):744-53.
doi: 10.2353/ajpath.2010.090667. Epub 2009 Dec 17.

Liver-specific beta-catenin knockout mice exhibit defective bile acid and cholesterol homeostasis and increased susceptibility to diet-induced steatohepatitis

Affiliations

Liver-specific beta-catenin knockout mice exhibit defective bile acid and cholesterol homeostasis and increased susceptibility to diet-induced steatohepatitis

Jaideep Behari et al. Am J Pathol. 2010 Feb.

Abstract

Although the role of Wnt/beta-catenin signaling in liver growth and development is well established, its contribution in non-neoplastic hepatic pathologies has not been investigated. Here, we examine the role of beta-catenin in a murine model of diet-induced liver injury. Mice with hepatocyte-specific beta-catenin deletion (KO) and littermate controls were fed the steatogenic methionine and choline-deficient (MCD) diet or the corresponding control diet for 2 weeks and characterized for histological, biochemical, and molecular changes. KO mice developed significantly higher steatohepatitis and fibrosis on the MCD diet compared with wild-type mice. Both wild-type and KO livers accumulated triglyceride on the MCD diet but, unexpectedly, higher hepatic cholesterol levels were observed in KO livers on both control and MCD diets. Gene expression analysis showed that hepatic cholesterol accumulation in KO livers was not attributable to increased synthesis or uptake. KO mice had lower expression of bile acid synthetic enzymes but exhibited higher hepatic bile acid and serum bilirubin levels, suggesting defects in bile export. Therefore, loss of beta-catenin in the liver leads to defective cholesterol and bile acid metabolism in the liver and increased susceptibility to developing steatohepatitis in the face of metabolic stress.


Figures
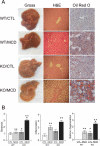
Figure 1
Figure 1
β-Catenin knockout mice fed the MCD diet develop severe steatohepatitis. A: Gross, H&E-, and oil red O–stained sections of livers from wild-type or KO mice fed either the control or MCD diets as indicated (liver sections at ×200 magnification). B: Quantification of steatosis, inflammation, and hepatocyte ballooning seen in the H&E stained sections by a pathologist blinded to the treatment groups. Values are expressed as means ± SEM from five to seven animals per group. *P < 0.05 wild-type versus KO groups, **P < 0.05 CTL versus MCD groups. WT/CTL indicates wild-type mice on control diet; WT/MCD, wild-type mice on MCD diet; KO/CTL, KO mice on the control diet; KO/MCD, KO mice on MCD diet.
Figure 2
Figure 2
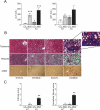
β-Catenin knockout mice on the MCD diet have more liver injury and fibrosis. A: Serum ALT and AST levels. B, Upper panel: Representative sections of livers from the four experimental groups stained with Trichrome and Reticulin stain (×200 magnification). Enhanced fibrosis is visible as blue color in Trichrome staining (×400; inset). Coarse black reticulin fibers consistent with increased pericellular fibrosis and focal early bridging can be seen in the KO/MCD group. B, Lower panel: Representative liver sections stained with α-SMA. The white arrowhead indicates increased α-SMA staining (brown color) in the KO/MCD group. C: Quantification of fibrosis and pericellular fibrosis of trichrome stained sections by a pathologist blinded to the treatment groups. Results are expressed as means ± SEM of samples from at least five animals, **P < 0.05 compared with all other groups, *P < 0.05 wild-type versus KO groups, ***P < 0.05 CTL versus MCD groups. WT/CTL indicates wild-type mice on control diet; WT/MCD, wild-type mice on MCD diet; KO/CTL, knockout mice on the control diet; KO/MCD, knockout mice on MCD diet.
Figure 3
Figure 3
Levels of β-catenin and its target genes in knockout and wild-type animals fed the control or MCD diets. A, Upper panel: Immunohistochemical staining with total β-catenin. Brown staining for β-catenin is visible in the two wild-type groups at the cell membrane. No staining is seen in the two KO groups. A, Lower panel: Glutamine synthetase staining. Brown glutamine synthetase staining is visible in a narrow rim of perivenous hepatocytes from wild-type animals fed either the control or MCD diets (black arrowhead). No staining is visible in KO livers (All images are at ×200 magnification). B: Western blot analysis for total β-catenin using liver lysates from the four experimental groups. Two representative samples from each experimental group are shown. The membrane was stripped and reprobed with β-actin as internal loading control. C: Western blot analysis for Cyp2E1 using liver microsomal preparation from each of the experimental groups. One representative sample from each group is shown. The membrane was stained with Ponceau red to confirm equal loading. WT/CTL indicates wild-type mice on control diet; WT/MCD, wild-type mice on MCD diet; KO/CTL, knockout mice on the control diet; KO/MCD, knockout mice on MCD diet.
Figure 4
Figure 4
Hepatic triglyceride and cholesterol levels in control-diet and MCD-diet fed wild-type and KO mice. A: Hepatic triglyceride levels. B: Hepatic cholesterol levels. Results are expressed as means ± SEM of five samples per group. *P < 0.05 wild-type versus KO groups, *P < 0.05 CTL versus MCD groups. WT/CTL indicates wild-type mice on control diet; WT/MCD, wild-type mice on MCD diet; KO/CTL, knockout mice on the control diet; KO/MCD, knockout mice on MCD diet.
Figure 5
Figure 5
Expression analysis by quantitative real-time PCR of genes involved in hepatic fatty acid and triglyceride metabolism. Results are expressed as means ± SEM of five to seven samples per group, with each sample analyzed in duplicate. *P < 0.05 wild-type versus KO groups, **P < 0.05 CTL versus MCD groups. WT/CTL indicates wild-type mice on control diet; WT/MCD, wild-type mice on MCD diet; KO/CTL, knockout mice on the control diet; KO/MCD, knockout mice on MCD diet.
Figure 6
Figure 6
Expression analysis by quantitative real-time PCR of genes involved in hepatic cholesterol metabolism. A: Genes involved in cholesterol biosynthesis. B: Genes involved in cholesterol efflux and transport. C: Genes encoding the cytochrome P450 enzymes involved in the metabolism of cholesterol to bile acids. Results are expressed as means ± SEM of five to seven samples per group, with each sample analyzed in duplicate. *P < 0.05 wild-type versus KO groups, **P < 0.05 CTL versus MCD groups. WT/CTL indicates wild-type mice on control diet; WT/MCD, wild-type mice on MCD diet; KO/CTL, knockout mice on the control diet; KO/MCD, knockout mice on MCD diet.
Figure 7
Figure 7
Analysis of hepatic bile acids and serum bilirubin levels. A: Hepatic total bile acid levels in wild-type and KO mice on control or MCD diet. B: Analysis of expression levels by real-time PCR of genes involved in export of bile acids and bilirubin. Data are expressed as arbitrary units relative to the expression level in the WT/CTL group. C: Representative serum samples from each treatment group. D: Serum total bilirubin levels. E: Analysis of expression levels of Hmox1 by real-time PCR. Results are expressed as means ± SEM of 5 samples per group, with each sample analyzed in duplicate. **P < 0.01 compared with all other groups, *P < 0.05 wild-type versus KO groups. WT/CTL indicates wild-type mice on control diet; WT/MCD, wild-type mice on MCD diet; KO/CTL, knockout mice on the control diet; KO/MCD, knockout mice on MCD diet.

References

    1. Miller JR. The Wnts. Genome Biol. 2002;3:REVIEWS3001. - PMC - PubMed
    1. Nelson WJ, Nusse R. Convergence of Wnt, beta-catenin, and cadherin pathways. Science. 2004;303:1483–1487. - PMC - PubMed
    1. Willert K, Nusse R. Beta-catenin: a key mediator of Wnt signaling. Curr Opin Genet Dev. 1998;8:95–102. - PubMed
    1. Barker N. The canonical Wnt/beta-catenin signalling pathway. Methods Mol Biol. 2008;468:5–15. - PubMed
    1. Brantjes H, Barker N, van Es J, Clevers H. TCF: lady Justice casting the final verdict on the outcome of Wnt signalling. Biol Chem. 2002;383:255–261. - PubMed

Publication types

MeSH terms