

Iron-dependent regulation of MDM2 influences p53 activity and hepatic carcinogenesis
- PMID: 20019189
- PMCID: PMC2808103
- DOI: 10.2353/ajpath.2010.090249
Iron-dependent regulation of MDM2 influences p53 activity and hepatic carcinogenesis
Abstract
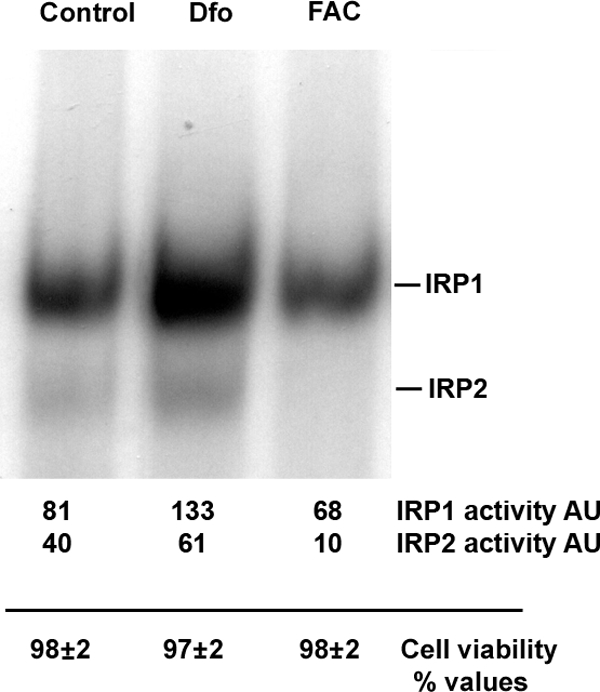
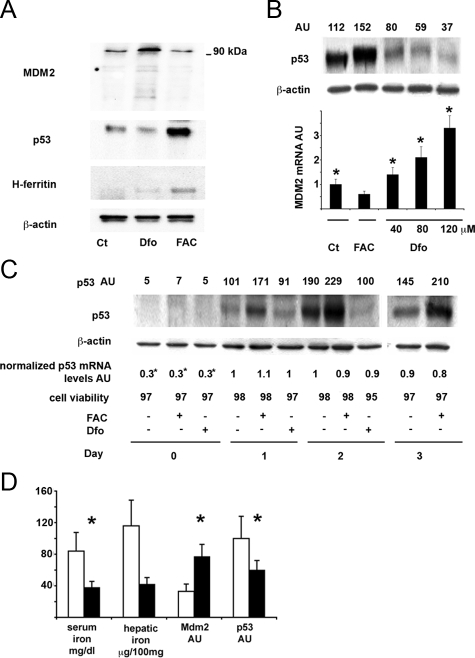
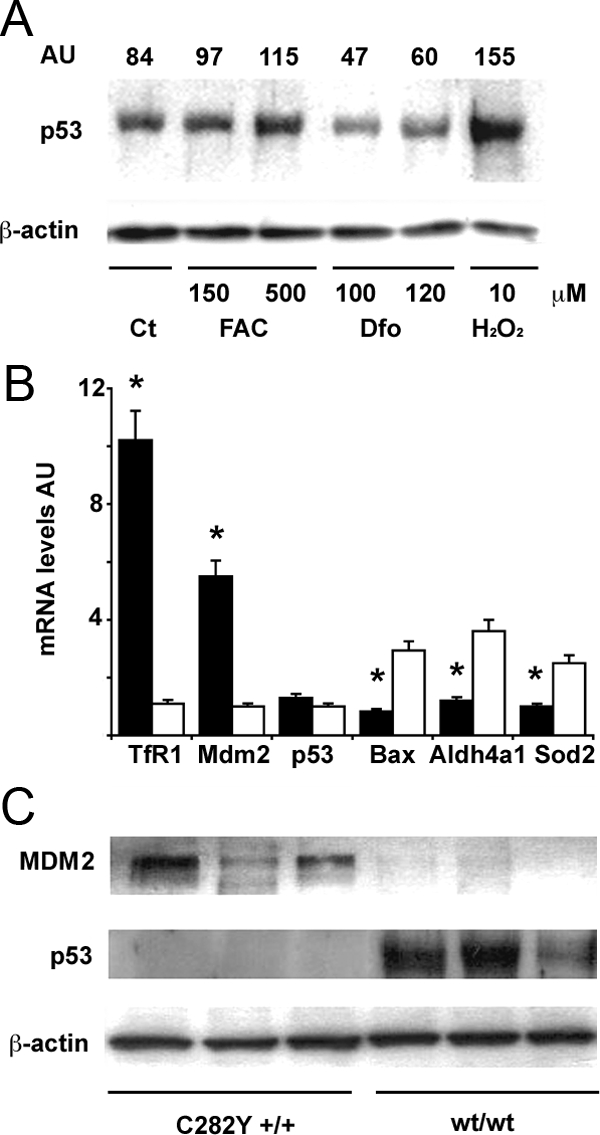
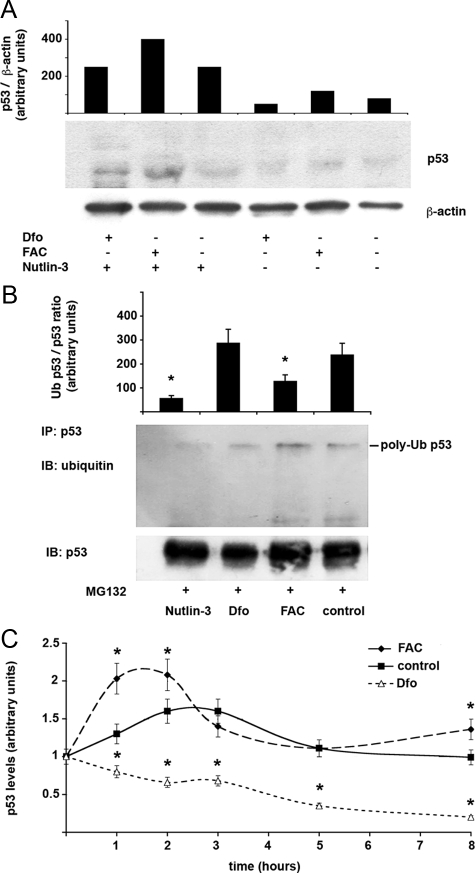
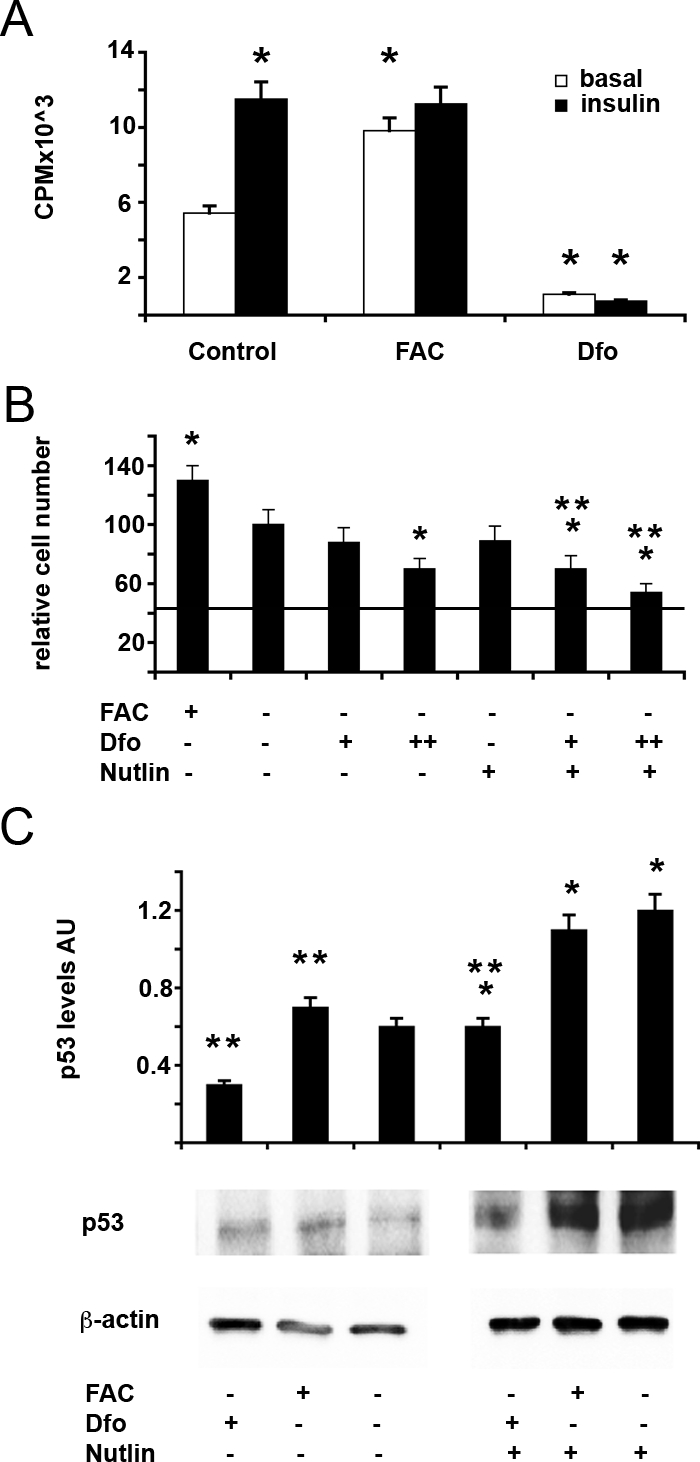
Iron overload is a risk factor for hepatocarcinoma, but the pathways involved are poorly characterized. Gene expression analysis in immortalized mouse hepatocytes exposed to iron or the iron chelator deferoxamine revealed that iron downregulated, whereas deferoxamine upregulated, mRNA levels of mouse double minute gene 2 (MDM2), the ubiquitin ligase involved in the degradation of the oncosuppressor p53. Regulation of MDM2 by iron status was observed at protein levels in mouse hepatocytes and rat liver, and was associated with specular changes in p53 expression. Iron dependent regulation of MDM2/p53 was confirmed ex-vivo in human monocytes, by manipulation of iron pool and in a genetic model of iron deficiency, leading to modulation of p53 target genes involved in the antioxidant response and apoptosis. Iron status influenced p53 ubiquitination and degradation rate, and the MDM2 inhibitor nutlin increased p53 levels in iron-depleted cells. Furthermore, nutlin enhanced the antiproliferative activity of deferoxamine in HepG2 hepatoblastoma cells. The MDM2 -309T > G promoter polymorphism, determining increased MDM2 and lower p53 activity, was associated with higher risk of hepatocarcinoma in cirrhotic patients with hemochromatosis, and with HFE mutations in patients with hepatocarcinoma without hemochromatosis, suggesting an interaction between MDM2 and iron in the pathogenesis of hepatocarcinoma. In conclusion, iron status influences p53 activity and antioxidant response by modulating MDM2 expression. MDM2 inhibitors may enhance the antiproliferative activity of iron chelators.
Figures

Similar articles
-
Interaction between p53 codon 72 and MDM2 309T>G polymorphisms and the risk of hepatocellular carcinoma.Tumour Biol. 2016 Mar;37(3):3863-70. doi: 10.1007/s13277-015-4222-4. Epub 2015 Oct 17. Tumour Biol. 2016. PMID: 26476535
-
p53-independent induction of rat hepatic Mdm2 following administration of phenobarbital and pregnenolone 16alpha-carbonitrile.Toxicol Sci. 2006 Dec;94(2):272-80. doi: 10.1093/toxsci/kfl115. Epub 2006 Sep 25. Toxicol Sci. 2006. PMID: 17000718
-
MDM2-p53 pathway in hepatocellular carcinoma.Cancer Res. 2014 Dec 15;74(24):7161-7. doi: 10.1158/0008-5472.CAN-14-1446. Epub 2014 Dec 4. Cancer Res. 2014. PMID: 25477334 Free PMC article. Review.
-
Transcription factor NFAT1 activates the mdm2 oncogene independent of p53.J Biol Chem. 2012 Aug 31;287(36):30468-76. doi: 10.1074/jbc.M112.373738. Epub 2012 Jul 11. J Biol Chem. 2012. PMID: 22787160 Free PMC article.
-
Dynamics in the p53-Mdm2 ubiquitination pathway.Cell Cycle. 2004 Jul;3(7):895-9. Epub 2004 Jul 2. Cell Cycle. 2004. PMID: 15254415 Review.
Cited by
-
Patatin-like phospholipase domain containing-3 gene I148M polymorphism, steatosis, and liver damage in hereditary hemochromatosis.World J Gastroenterol. 2012 Jun 14;18(22):2813-20. doi: 10.3748/wjg.v18.i22.2813. World J Gastroenterol. 2012. PMID: 22719190 Free PMC article.
-
Iron: The cancer connection.Mol Aspects Med. 2020 Oct;75:100860. doi: 10.1016/j.mam.2020.100860. Epub 2020 Apr 25. Mol Aspects Med. 2020. PMID: 32340745 Free PMC article. Review.
-
p53 tumor suppressor and iron homeostasis.FEBS J. 2019 Feb;286(4):620-629. doi: 10.1111/febs.14638. Epub 2018 Sep 4. FEBS J. 2019. PMID: 30133149 Free PMC article. Review.
-
Ferredoxin reductase is critical for p53-dependent tumor suppression via iron regulatory protein 2.Genes Dev. 2017 Jun 15;31(12):1243-1256. doi: 10.1101/gad.299388.117. Epub 2017 Jul 26. Genes Dev. 2017. PMID: 28747430 Free PMC article.
-
Upregulated microRNA-450b-5p represses the development of acute liver failure via modulation of liver function, inflammatory response, and hepatocyte apoptosis.Immun Inflamm Dis. 2023 Feb;11(2):e767. doi: 10.1002/iid3.767. Immun Inflamm Dis. 2023. PMID: 36840487 Free PMC article.
References
-
- Fracanzani AL, Fargion S, Stazi MA, Valenti L, Amoroso P, Cariani E, Sangiovanni A, Tommasini M, Rossini A, Bertelli C, Fatta E, Patriarca V, Brescianini S, Stroffolini T. Association between heterozygosity for HFE gene mutations and hepatitis viruses in hepatocellular carcinoma. Blood Cells Mol Dis. 2005;35:27–32. - PubMed
-
- Farazi PA, DePinho RA. Hepatocellular carcinoma pathogenesis: from genes to environment. Nat Rev Cancer. 2006;6:674–687. - PubMed
-
- Fracanzani AL, Taioli E, Sampietro M, Fatta E, Bertelli C, Fiorelli G, Fargion S. Liver cancer risk is increased in patients with porphyria cutanea tarda in comparison to matched control patients with chronic liver disease. J Hepatol. 2001;35:498–503. - PubMed
-
- Nahon P, Sutton A, Rufat P, Ziol M, Thabut G, Schischmanoff PO, Vidaud D, Charnaux N, Couvert P, Ganne-Carrie N, Trinchet JC, Gattegno L, Beaugrand M. Liver iron, HFE gene mutations, and hepatocellular carcinoma occurrence in patients with cirrhosis. Gastroenterology. 2008;134:102–110. - PubMed
-
- Fracanzani AL, Conte D, Fraquelli M, Taioli E, Mattioli M, Losco A, Fargion S. Increased cancer risk in a cohort of 230 patients with hereditary hemochromatosis in comparison to matched control patients with non-iron-related chronic liver disease. Hepatology. 2001;33:647–651. - PubMed
Publication types
MeSH terms
Substances
LinkOut - more resources
Full Text Sources
Medical
Molecular Biology Databases
Research Materials
Miscellaneous
