. 2009 Dec 18;326(5960):1668-74.
doi: 10.1126/science.1180310.

Crystal structure of the eukaryotic strong inward-rectifier K+ channel Kir2.2 at 3.1 A resolution

Affiliations

Crystal structure of the eukaryotic strong inward-rectifier K+ channel Kir2.2 at 3.1 A resolution

Xiao Tao et al. Science. .

Abstract

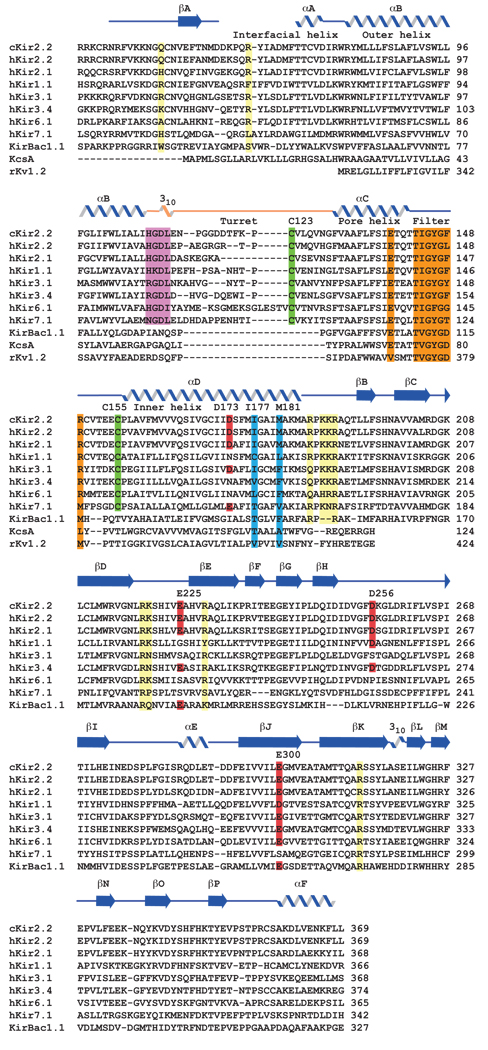
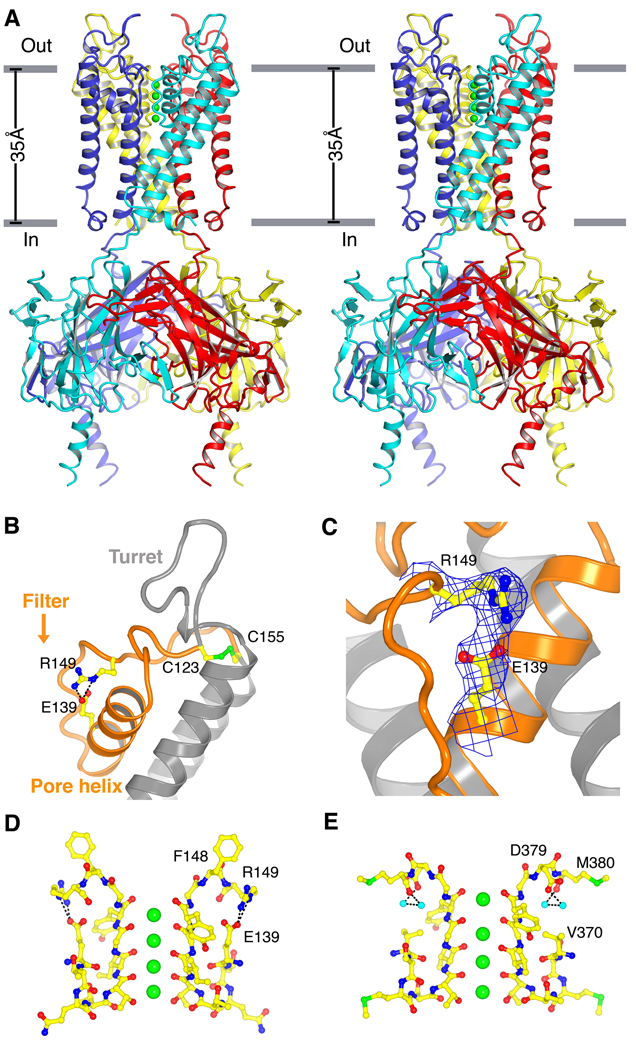
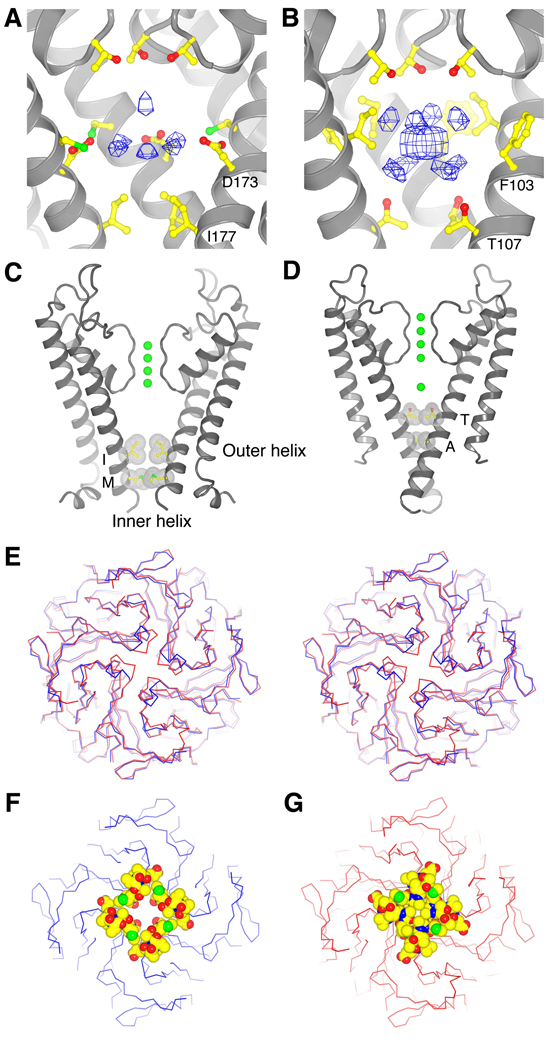
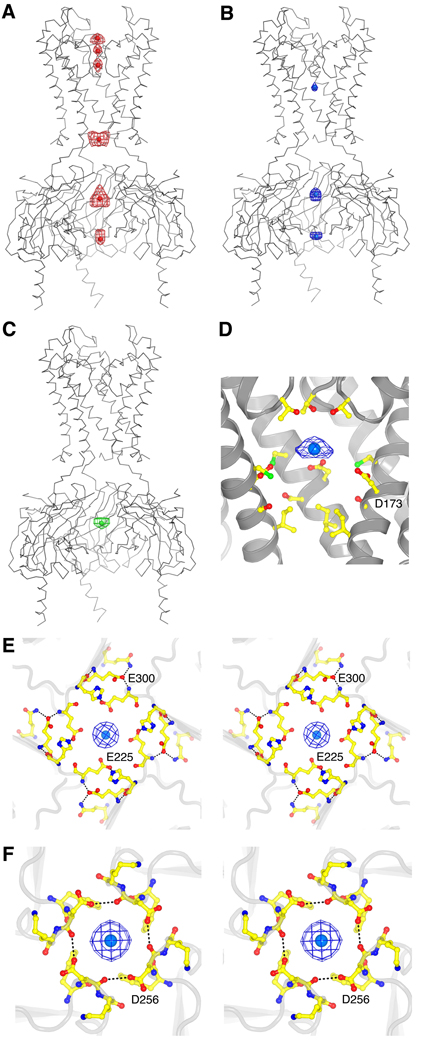
Inward-rectifier potassium (K+) channels conduct K+ ions most efficiently in one direction, into the cell. Kir2 channels control the resting membrane voltage in many electrically excitable cells, and heritable mutations cause periodic paralysis and cardiac arrhythmia. We present the crystal structure of Kir2.2 from chicken, which, excluding the unstructured amino and carboxyl termini, is 90% identical to human Kir2.2. Crystals containing rubidium (Rb+), strontium (Sr2+), and europium (Eu3+) reveal binding sites along the ion conduction pathway that are both conductive and inhibitory. The sites correlate with extensive electrophysiological data and provide a structural basis for understanding rectification. The channel's extracellular surface, with large structured turrets and an unusual selectivity filter entryway, might explain the relative insensitivity of eukaryotic inward rectifiers to toxins. These same surface features also suggest a possible approach to the development of inhibitory agents specific to each member of the inward-rectifier K+ channel family.


Figures

Fig. 1
Fig. 1
Key residues in eukaryotic Kir channels. Sequence alignment of chicken Kir2.2 (GI:118097849), human Kir2.2 (GI:23110982), human Kir2.1 (GI:8132301), human Kir1.1 (GI:1352479), human Kir3.1 (GI:1352482), human Kir3.4 (GI:1352484), human Kir6.1 (GI:2493600), human Kir7.1 (GI:3150184), KirBac1.1 (GI:33357898), KcsA (GI:39654804), and rat Kv1.2 (GI:73536156). For all the Kir sequences only the core region corresponding to the expressed protein and atomic structure of Kir2.2 is included in the alignment. For Kv1.2 only the transmembrane pore region is shown. Secondary structure elements are indicated above the sequences and the turret is colored orange. Residues discussed in the text are highlighted in red (acidic residues), green (two disulfide-bonded cysteines), cyan (the inner helix bundle activation gate), purple (conserved residues among the turrets of eukaryotic Kir channels), orange (the selectivity filter and E139), and yellow (critical residues for channel-PIP2 interactions). Abbreviations for the amino acid residues are as follows: A, Ala; C, Cys; D, Asp; E, Glu; F, Phe; G, Gly; H, His; I, Ile; K, Lys; L, Leu; M, Met; N, Asn; P, Pro; Q, Gln; R, Arg; S, Ser; T, Thr; V, Val; W, Trp; and Y, Tyr.
Fig. 2
Fig. 2
Structure of Kir2.2. (A) Stereoview of a ribbon representation of the Kir2.2 tetramer from the side with the extracellular solution above. Four subunits of the channel are uniquely colored. Approximate boundaries of the lipid bilayer are shown as gray bars. (B) A close-up view of the pore-region of a single subunit (in ribbon representation) with the turret, pore helix and selectivity filter labeled. Side chains of residues E139, R149 and a pair of disulfide-bonded cysteines (C123 and C155) are shown as sticks and colored according to atom type: carbon, yellow; nitrogen, blue; oxygen, red; and sulfur, green. Ionized hydrogen bonds are indicated by dashed black lines. The region flanked by the two disulfide-bonded cysteines is colored orange. (C) Electron density (blue wire mesh, 2Fo-Fc, calculated from 50 to 3.1Å using phases from the final model and contoured at 1.0 σ) is shown for the side chains of E139 and R149 [sticks, colored the same scheme as in (B)] forming a salt bridge. (D and E) K+ selectivity filter of the Kir2.2 channel (D) compared with that of the Kv1.2-Kv2.1 paddle chimera channel [(E), PDB ID 2R9R]. For clarity, only two of the four subunits [sticks, colored with the same scheme as in (B)] are shown. K+ (green spheres), water molecules (cyan spheres), and hydrogen bonds between R149 and E139 (Kir, dashed black lines), or between D379, M380 and waters (Kv, dashed black lines) are shown.
Fig. 3
Fig. 3
The cavity and gates. (A and B) Electron density in the cavity of the Kir2.2 channel [(A), Fo-Fc omit map, calculated from 50 to 3.1Å using phases from the final model and contoured at 2.0 σ] and of the KcsA channel [(B), PDB ID 1K4C, Fo-Fc omit map, calculated from 50 to 3.1Å using phases from the final model and contoured at 2.8 σ]. The channels are shown as ribbon representations with the subunit closest to the viewer removed. Only the side chains facing the cavity are shown (sticks). (C and D) Comparison of the transmembrane inner helix bundle activation gate of Kir2.2 (C) with the KcsA structure [(D), PDB ID 1K4C]. For clarity, only two of the four subunits (gray ribbon) are shown. Side chains of the residues in the bundle crossing are shown as sticks [colored with the same scheme as in (B)] and van der Waals surfaces (gray dots). K+ ions are shown as green spheres. Inner and outer helices are indicated. (E) Superposition of the chicken Kir2.2 cytoplasmic domain (blue α-carbon trace) and the mouse Kir2.1 cytoplasmic domain (red α-carbon trace, PDB ID 1U4F) in stereo viewed from the extracellular side. (F and G) Comparison of the apex (G loop) of the cytoplasmic pores of Kir2.2 (F) and mouse Kir2.1 (G), with the same view as (E). The cytoplasmic domains are shown as α-carbon traces, with residues 303 to 309 (Kir2.2) and 302 to 308 (Kir2.1) shown as CPK models (carbon, yellow; nitrogen, blue; oxygen, red; and sulfur, green).
Fig. 4
Fig. 4
Ion binding sites. (A to C) Electron density (wire mesh) of Rb+ [(A), Fo-Fc map calculated to 4.0 Å, contoured at 3.5 σ for density in the filter and 2.0 σ for density elsewhere], Sr2+ [(B), 10 mM, Fo-Fc map calculated to 3.3 Å, contoured at 1.5 σ for density in the cavity and 3.0 σ for density elsewhere] and Eu3+ [(C), 10 mM, anomalous difference map calculated to 6.0 Å, contoured at 2.8 σ] inside the Kir2.2 channel ion conduction pathway. Kir2.2 is represented as a gray α-carbon trace with the transmembrane domain and cytoplasmic domain closest to the viewer removed for clarity. The ions are shown as spheres and colored red (Rb+), blue (Sr2+), and green (Eu3+). (D) Electron density (200 mM Sr2+, Fo-Fc map calculated from 50 to 3.8 Å, contoured at 2.5 σ, blue wire mesh) of Sr2+ (blue-green spheres) in the cavity of Kir2.2. The channel is shown as a ribbon with the subunit closest to the viewer removed. Only the side chains facing the cavity are shown (sticks). (E) Stereoview of the ion binding site near the upper ring of charges in the cytoplasmic domain of Kir2.2, viewed from the extracellular side. Residues E225, H227, E300, and Q311 are shown as sticks, and hydrogen bonds between them are indicated as dashed black lines. Electron density (200 mM Sr2+, Fo-Fc map calculated from 50 to 3.8 Å, contoured at 4.5 σ) of Sr2+ (blue-green spheres) is shown as blue wire mesh. (F) Stereoview of the ion binding site at the lower ring of charges in the cytoplasmic domain of Kir2.2, viewed from the intracellular side. Residues F255, D256, and K257 are shown as sticks, and hydrogen bonds between D256 from different subunits are indicated as dashed black lines. Electron density (200 mM Sr2+, Fo-Fc map calculated from 50 to 3.8 Å, contoured at 4.5 σ) of Sr2+ (blue-green spheres) is shown as blue wire mesh.
Fig. 5
Fig. 5
Unique structure of the extracellular entryway. (A and B) Surface representation of chicken Kir2.2 (A) and Kv1.2–Kv2.1 paddle chimera [(B), PDB ID 2R9R] in stereo, viewed from the extracellular side. The four protrusions formed by the top of the turrets are highlighted with a black perimeter and F148 in Kir2.2 is labeled. (C) Stereo representation of electron density (gray wire mesh) for the turret region (2Fo-Fc, calculated from 50 to 3.1Å using phases from the final model and contoured at 1.0 σ). The turret is shown as sticks (colored according to atom types), and residues corresponding to the highlighted protrusions in (A) are labeled. (D) A close-up view of the turret region in a single subunit in stereo. Side chains of those conserved residues among the turrets of eukaryotic Kir channels, as well as C155 are shown as sticks. Hydrogen bonds between H108, D110 and C123 are indicated as dashed black lines.

Similar articles

Cited by

References

    1. Hodgkin AL, Huxley AF, Katz B. Arch. Sci. Physiol. (Paris) 1949;3:129.
    1. Katz B. Arch. Sci. Physiol. (Paris) 1949;3:285.
    1. Hille B. Ion Channels of Excitable Membranes. Sunderland, MA: Sinauer Associates; 2001.
    1. Fakler B, et al. Cell. 1995 Jan 13;80:149. - PubMed
    1. Lopatin AN, Makhina EN, Nichols CG. Nature. 1994 Nov 24;372:366. - PubMed

Publication types

MeSH terms

Associated data