

The ubiquity of energy-dense snack foods: a national multicity study
- PMID: 20019297
- PMCID: PMC2804650
- DOI: 10.2105/AJPH.2009.178681
The ubiquity of energy-dense snack foods: a national multicity study
Abstract
Objectives: We assessed the availability and accessibility of energy-dense snacks in retail stores whose primary merchandise was not food and whether these varied by store type, region, or socioeconomic factors.
Methods: We conducted systematic observations of 1082 retail stores in 19 US cities and determined the availability and accessibility of 6 categories of energy-dense snack foods.
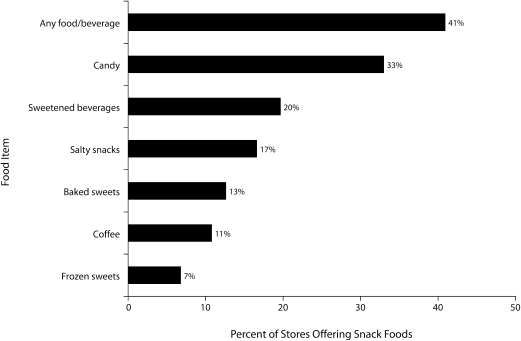
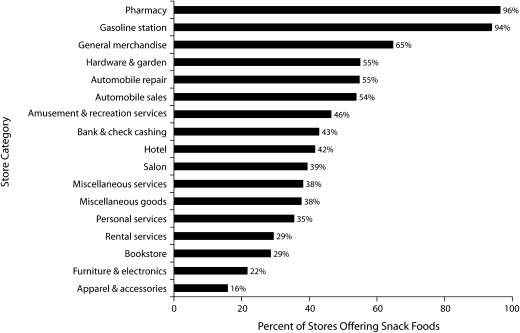
Results: Snack food was available in 41% of the stores; the most common forms were candy (33%), sweetened beverages (20%), and salty snacks (17%). These foods were often within arm's reach of the cash register queue. We observed snack foods in 96% of pharmacies, 94% of gasoline stations, 22% of furniture stores, 16% of apparel stores, and 29% to 65% of other types of stores. Availability varied somewhat by region but not by the racial or socioeconomic characteristics of nearby census tracts.
Conclusions: Energy-dense snack foods and beverages, implicated as contributors to the obesity epidemic, are widely available in retail stores whose primary business is not food. The ubiquity of these products may contribute to excess energy consumption in the United States.
Figures
Similar articles
-
School food environments and practices affect dietary behaviors of US public school children.J Am Diet Assoc. 2009 Feb;109(2 Suppl):S91-107. doi: 10.1016/j.jada.2008.10.059. J Am Diet Assoc. 2009. PMID: 19166677
-
Multicontextual correlates of energy-dense, nutrient-poor snack food consumption by adolescents.Appetite. 2017 May 1;112:23-34. doi: 10.1016/j.appet.2017.01.008. Epub 2017 Jan 9. Appetite. 2017. PMID: 28082196 Free PMC article.
-
Presence of Candy and Snack Food at Checkout in Chain Stores: Results of a Pilot Study.J Community Health. 2016 Oct;41(5):1090-3. doi: 10.1007/s10900-016-0193-7. J Community Health. 2016. PMID: 27101366
-
Snack food and beverage consumption and young child nutrition in low- and middle-income countries: A systematic review.Matern Child Nutr. 2019 Jun;15 Suppl 4(Suppl 4):e12729. doi: 10.1111/mcn.12729. Matern Child Nutr. 2019. PMID: 31225715 Free PMC article.
-
A review of snacking patterns among children and adolescents: what are the implications of snacking for weight status?Child Obes. 2013 Apr;9(2):104-15. doi: 10.1089/chi.2012.0108. Epub 2013 Mar 7. Child Obes. 2013. PMID: 23470091 Review.
Cited by
-
A Cross-Sectional Analysis of Health Behavior in School-Aged Children: The Qassim Study.Cureus. 2023 Nov 7;15(11):e48420. doi: 10.7759/cureus.48420. eCollection 2023 Nov. Cureus. 2023. PMID: 37942128 Free PMC article.
-
The availability of snack food displays that may trigger impulse purchases in Melbourne supermarkets.BMC Public Health. 2012 Mar 15;12:194. doi: 10.1186/1471-2458-12-194. BMC Public Health. 2012. PMID: 22420759 Free PMC article.
-
Habit strength and between-meal snacking in daily life: the moderating role of level of education.Public Health Nutr. 2018 Oct;21(14):2595-2605. doi: 10.1017/S1368980018001283. Epub 2018 May 29. Public Health Nutr. 2018. PMID: 29808785 Free PMC article.
-
Differences in healthy food supply and stocking practices between small grocery stores, gas-marts, pharmacies and dollar stores.Public Health Nutr. 2016 Feb;19(3):540-7. doi: 10.1017/S1368980015002724. Epub 2015 Sep 28. Public Health Nutr. 2016. PMID: 26411535 Free PMC article.
-
Change in an urban food environment within a single year: Considerations for food-environment research and community health.Prev Med Rep. 2020 Apr 22;19:101102. doi: 10.1016/j.pmedr.2020.101102. eCollection 2020 Sep. Prev Med Rep. 2020. PMID: 32642401 Free PMC article.
References
-
- Ogden CL, Yanovski SZ, Carroll MD, Flegal KM. The epidemiology of obesity. Gastroenterology 2007;132(6):2087–2102 - PubMed
-
- CDC Trends in intake of energy and macronutrients—United States, 1971–2000. MMWR Morb Mortal Wkly Rep 2004;53(4):80–82 - PubMed
-
- Putnam J. Major trends in U.S. food supply, 1909–99. Food Rev 2000;23(1):8–15
-
- Nielsen SJ, Siega-Riz AM, Popkin BM. Trends in energy intake in U.S. between 1977 and 1996: similar shifts seen across age groups. Obes Res 2002;10(5):370–378 - PubMed
Publication types
MeSH terms
Substances
Grants and funding
LinkOut - more resources
Full Text Sources
Medical
