

MR-guided transcranial brain HIFU in small animal models
- PMID: 20019400
- PMCID: PMC3042749
- DOI: 10.1088/0031-9155/55/2/003
MR-guided transcranial brain HIFU in small animal models
Abstract
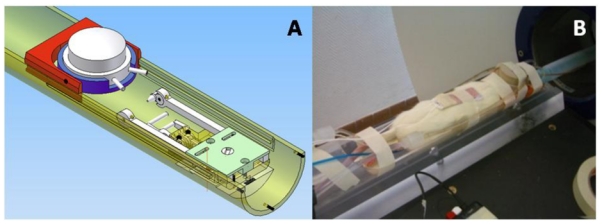
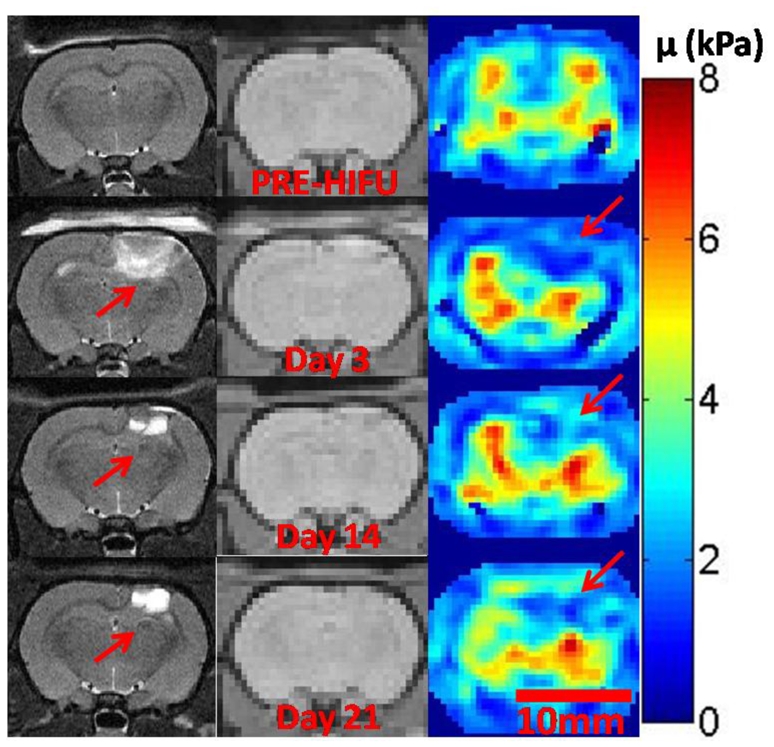
Recent studies have demonstrated the feasibility of transcranial high-intensity focused ultrasound (HIFU) therapy in the brain using adaptive focusing techniques. However, the complexity of the procedures imposes provision of accurate targeting, monitoring and control of this emerging therapeutic modality in order to ensure the safety of the treatment and avoid potential damaging effects of ultrasound on healthy tissues. For these purposes, a complete workflow and setup for HIFU treatment under magnetic resonance (MR) guidance is proposed and implemented in rats. For the first time, tissue displacements induced by the acoustic radiation force are detected in vivo in brain tissues and measured quantitatively using motion-sensitive MR sequences. Such a valuable target control prior to treatment assesses the quality of the focusing pattern in situ and enables us to estimate the acoustic intensity at focus. This MR-acoustic radiation force imaging is then correlated with conventional MR-thermometry sequences which are used to follow the temperature changes during the HIFU therapeutic session. Last, pre- and post-treatment magnetic resonance elastography (MRE) datasets are acquired and evaluated as a new potential way to non-invasively control the stiffness changes due to the presence of thermal necrosis. As a proof of concept, MR-guided HIFU is performed in vitro in turkey breast samples and in vivo in transcranial rat brain experiments. The experiments are conducted using a dedicated MR-compatible HIFU setup in a high-field MRI scanner (7 T). Results obtained on rats confirmed that both the MR localization of the US focal point and the pre- and post-HIFU measurement of the tissue stiffness, together with temperature control during HIFU are feasible and valuable techniques for efficient monitoring of HIFU in the brain. Brain elasticity appears to be more sensitive to the presence of oedema than to tissue necrosis.
Figures


Similar articles
-
Monitoring MR-guided high intensity focused ultrasound therapy using transient supersonic shear wave MR-elastography.Phys Med Biol. 2023 Jan 24;68(3). doi: 10.1088/1361-6560/acac5e. Phys Med Biol. 2023. PMID: 36595333
-
MR-ARFI-based method for the quantitative measurement of tissue elasticity: application for monitoring HIFU therapy.Phys Med Biol. 2018 May 4;63(9):095018. doi: 10.1088/1361-6560/aabd0d. Phys Med Biol. 2018. PMID: 29633958
-
Self-Scanned HIFU Ablation of Moving Tissue Using Real-Time Hybrid US-MR Imaging.IEEE Trans Biomed Eng. 2019 Aug;66(8):2182-2191. doi: 10.1109/TBME.2018.2885233. Epub 2018 Dec 5. IEEE Trans Biomed Eng. 2019. PMID: 30530308
-
Advances in MR image-guided high-intensity focused ultrasound therapy.Int J Hyperthermia. 2015 May;31(3):225-32. doi: 10.3109/02656736.2014.976773. Epub 2014 Nov 6. Int J Hyperthermia. 2015. PMID: 25373687 Review.
-
MR techniques for guiding high-intensity focused ultrasound (HIFU) treatments.J Magn Reson Imaging. 2018 Feb;47(2):316-331. doi: 10.1002/jmri.25770. Epub 2017 Jun 5. J Magn Reson Imaging. 2018. PMID: 28580706 Review.
Cited by
-
Development of a multi-functional preclinical device for the treatment of glioblastoma.Biomed Opt Express. 2021 Mar 23;12(4):2264-2279. doi: 10.1364/BOE.419412. eCollection 2021 Apr 1. Biomed Opt Express. 2021. PMID: 33996228 Free PMC article.
-
Adapting MRI acoustic radiation force imaging for in vivo human brain focused ultrasound applications.Magn Reson Med. 2013 Mar 1;69(3):724-33. doi: 10.1002/mrm.24308. Epub 2012 May 3. Magn Reson Med. 2013. PMID: 22555751 Free PMC article.
-
Simultaneous MR thermometry and acoustic radiation force imaging using interleaved acquisition.Magn Reson Med. 2018 Mar;79(3):1515-1524. doi: 10.1002/mrm.26827. Epub 2017 Aug 10. Magn Reson Med. 2018. PMID: 28795419 Free PMC article.
-
Synchronous temperature variation monitoring during ultrasound imaging and/or treatment pulse application: a phantom study.IEEE Open J Ultrason Ferroelectr Freq Control. 2021;1:1-10. doi: 10.1109/ojuffc.2021.3085539. Epub 2021 Jun 3. IEEE Open J Ultrason Ferroelectr Freq Control. 2021. PMID: 34713274 Free PMC article.
-
Histologic safety of transcranial focused ultrasound neuromodulation and magnetic resonance acoustic radiation force imaging in rhesus macaques and sheep.Brain Stimul. 2020 May-Jun;13(3):804-814. doi: 10.1016/j.brs.2020.02.017. Epub 2020 Feb 21. Brain Stimul. 2020. PMID: 32289711 Free PMC article.
References
-
- Abolhassani MD, Norouzy A, Takavar A, Ghanaati H. Noninvasive temperature estimation using sonographic digital images. J Ultrasound Med. 2007 Feb;26(2):215–22. - PubMed
-
- Arthur RM, Straube WL, Starman JD, Moros EG. Noninvasive temperature estimation based on the energy of backscattered ultrasound. Med Phys. 2003 Jun;30(6):1021–9. - PubMed
-
- Arthur RM, Straube WL, Trobaugh JW, Moros EG. In vivo change in ultrasonic backscattered energy with temperature in motion-compensated images. Int J Hyperthermia. 2008 Aug;24(5):389–98. - PubMed
-
- Aubry JF, Tanter M, Pernot M, Thomas JL, Fink M. Experimental demonstration of noninvasive transskull adaptive focusing based on prior computed tomography scans. J Acoust Soc Am. 2003 Jan;113(1):84–93. - PubMed
MeSH terms
LinkOut - more resources
Full Text Sources
Other Literature Sources
Medical
Research Materials