. 2009 Dec;5(12):e1000612.
doi: 10.1371/journal.pcbi.1000612. Epub 2009 Dec 18.

Nano-motion dynamics are determined by surface-tethered selectin mechanokinetics and bond formation

Affiliations

Nano-motion dynamics are determined by surface-tethered selectin mechanokinetics and bond formation

Brian J Schmidt et al. PLoS Comput Biol. 2009 Dec.

Abstract

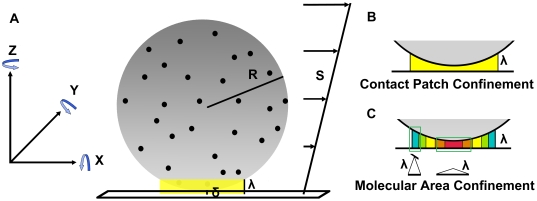
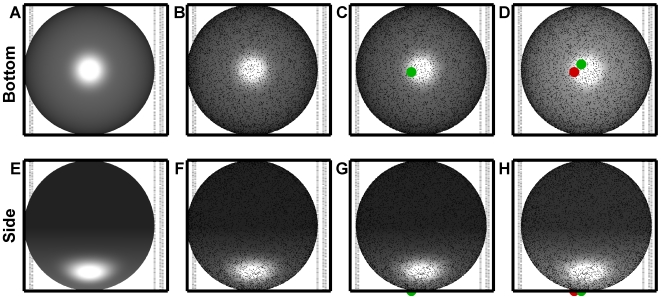
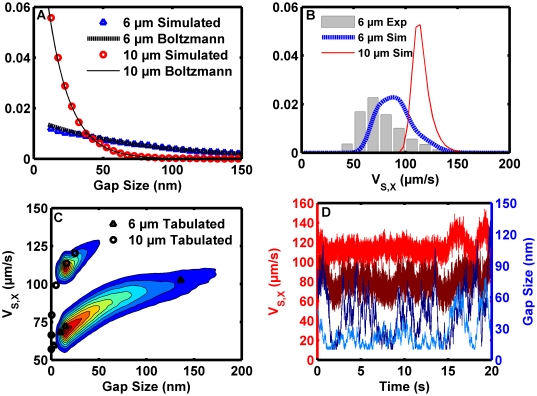
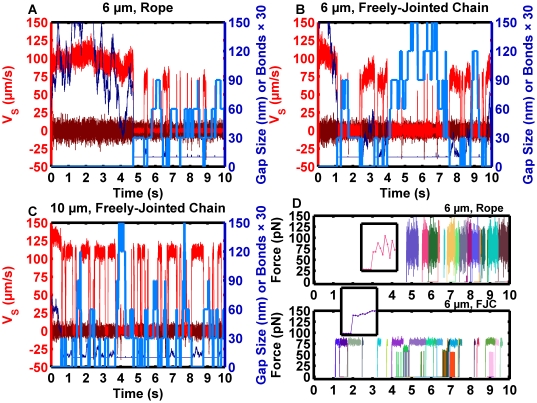
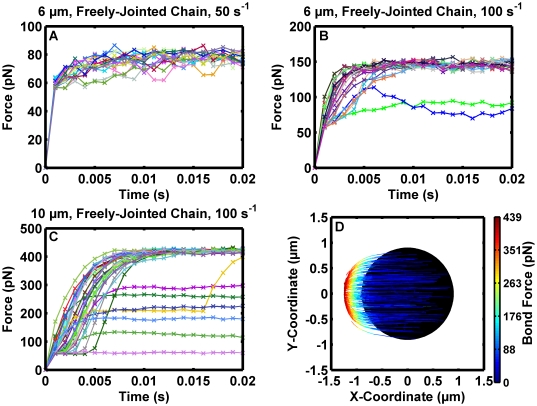
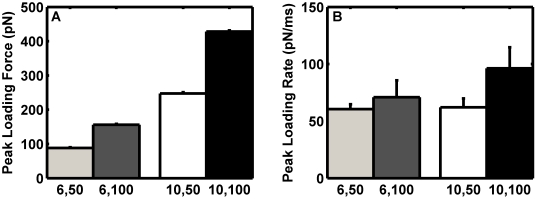
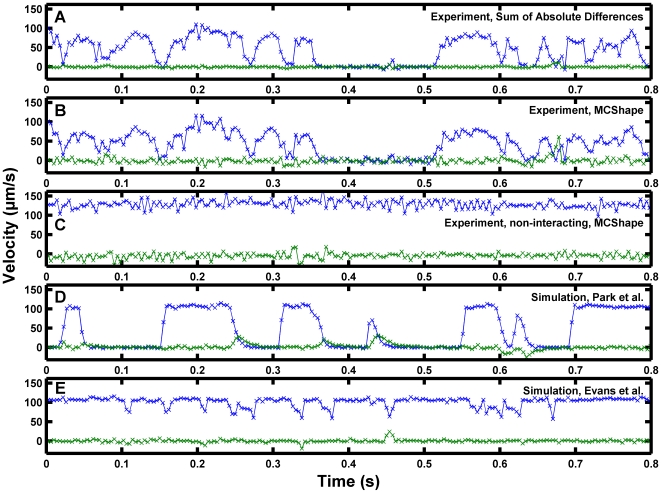
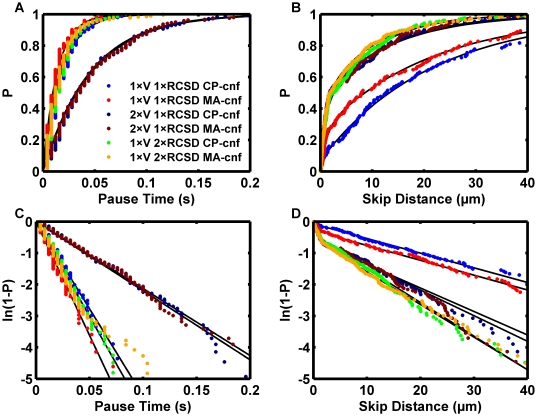
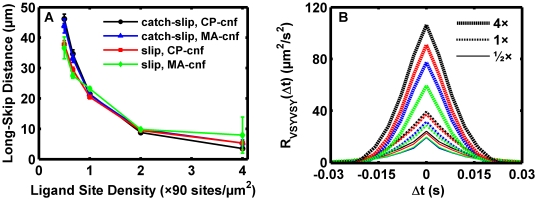
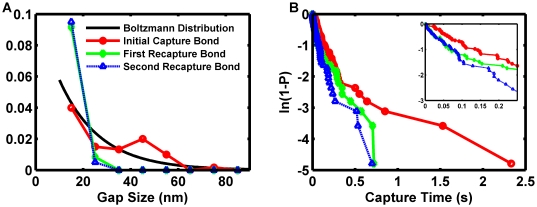
The interaction of proteins at cellular interfaces is critical for many biological processes, from intercellular signaling to cell adhesion. For example, the selectin family of adhesion receptors plays a critical role in trafficking during inflammation and immunosurveillance. Quantitative measurements of binding rates between surface-constrained proteins elicit insight into how molecular structural details and post-translational modifications contribute to function. However, nano-scale transport effects can obfuscate measurements in experimental assays. We constructed a biophysical simulation of the motion of a rigid microsphere coated with biomolecular adhesion receptors in shearing flow undergoing thermal motion. The simulation enabled in silico investigation of the effects of kinetic force dependence, molecular deformation, grouping adhesion receptors into clusters, surface-constrained bond formation, and nano-scale vertical transport on outputs that directly map to observable motions. Simulations recreated the jerky, discrete stop-and-go motions observed in P-selectin/PSGL-1 microbead assays with physiologic ligand densities. Motion statistics tied detailed simulated motion data to experimentally reported quantities. New deductions about biomolecular function for P-selectin/PSGL-1 interactions were made. Distributing adhesive forces among P-selectin/PSGL-1 molecules closely grouped in clusters was necessary to achieve bond lifetimes observed in microbead assays. Initial, capturing bond formation effectively occurred across the entire molecular contour length. However, subsequent rebinding events were enhanced by the reduced separation distance following the initial capture. The result demonstrates that vertical transport can contribute to an enhancement in the apparent bond formation rate. A detailed analysis of in silico motions prompted the proposition of wobble autocorrelation as an indicator of two-dimensional function. Insight into two-dimensional bond formation gained from flow cell assays might therefore be important to understand processes involving extended cellular interactions, such as immunological synapse formation. A biologically informative in silico system was created with minimal, high-confidence inputs. Incorporating random effects in surface separation through thermal motion enabled new deductions of the effects of surface-constrained biomolecular function. Important molecular information is embedded in the patterns and statistics of motion.


Conflict of interest statement

The authors have declared that no competing interests exist.

Figures

Figure 1
Figure 1. Simulation geometry.
(A) A Cartesian coordinate system was employed. Flow was applied in the X-direction with a linear shear rate, S. A three dimensional sphere with a fixed radius, R, was coated with receptors, and each anchor point of the base of the receptor's tether region to the surface of the sphere is shown as a black dot. Only the receptors within an unstressed receptor/ligand contour length of the surface, λ, were allowed to form bonds. This region has been highlighted in yellow. The gap between the base of the sphere and the surface, δ, was allowed to vary. The diffusion of the sphere was included in the simulation. The diffusion had six components with the inclusion of rotation in the sphere's motion. Motion perpendicular to the flow direction, along the Y-axis, is referred to as “wobble” in the text. (B,C) Two different models of reactivity for molecules in the contact volume were included in the simulations. For contact patch confinement, described mathematically by (1), all of the receptors on the sphere within an unstressed receptor/ligand contour length of the surface were assumed to react with a constant rate. For molecular area confinement, described mathematically by (2), receptors immobilized on portions of the sphere closest to the surface were allowed to form bonds with an increased rate proportional to the area of the projection of the molecular contour length onto the XY plane. The colors in (B,C) depict the relative reaction rate of receptors, and warmer colors indicate an increased reaction rate.
Figure 2
Figure 2. Iterative calculations in the simulation.
(A,E) An initial gap size, generally small compared to the sphere's radius, was randomly selected from the governing equilibrium distribution. (B,F) Receptors were randomly distributed over the surface. Fluid flow was started. Forces and torques were calculated, a diffusive component was added, the new sphere position and rotation was calculated, and receptors were tested for bond formation. (C,G) The sphere was translated and rotated into the new position. One bond formed in the calculation from the previous step. New force calculations on the bonds and sphere were performed. The bond's green color indicates the sphere had not yet moved enough to begin mechanically stressing the bond. The new sphere position and rotation was calculated based on the forces and toques plus the diffusive component, then free receptors were tested for formation, and the existing bond was tested for breakage with the current position. (D,H) The sphere was translated and rotated into the new position. The brighter sphere coloring indicates the sphere moved closer to the ligand-coated surface. Vertical motion was significant compared to the length of a bond. The bond from the previous step was still present, and a new bond formed. If the new bond were to survive until it became stressed, it would exert a force perpendicular to the flow direction that will cause the sphere to wobble because it is off the sphere's center line. Force calculations on the bonds and sphere were performed. The red color indicates the trailing bond was stressed and exerted forces and torques on the sphere. Next, the diffusive component would be added to the forces and torques on the sphere, the new sphere position and rotation would be calculated, then free receptors would be tested for formation and the existing bonds would be tested for breakage. The position would be updated and the calculation iterated.
Figure 3
Figure 3. Investigation of non-reactive microsphere motion with a 50 s−1 wall shear rate.
(A) The probability distribution functions for gap size for a simulated 6 µm-diameter sphere (blue triangles), the theoretical Boltzmann distribution for a 6 µm-diameter sphere (heavy dashed line), a simulated 10 µm-diameter sphere (red circles), and the theoretical Boltzmann distribution for a 10 µm-diameter sphere (narrow solid line) are shown. The simulation results agree well with the equilibrium theory and demonstrate vertical diffusion occurs over a biochemically relevant length. (B) Sampled instantaneous, flow-direction velocity probability distribution functions for a 6 µm-diameter sphere (heavy blue dashed line) and a 10 µm-diameter sphere (narrow red line) are shown and compared to the experimental results with microbeads possessing a nominal diameter of 6 µm (grey bars). The results demonstrate the experimentally observed skewing of the instantaneous velocity distribution from normal and predict a tighter velocity distribution for larger particles. (C) Contour plots of the probability distribution functions of the sampled instantaneous, flow-direction velocity for a simulated 6 µm sphere (bottom) and a 10 µm simulated sphere (top) at 50 s−1 are shown. Each was re-normalized to the respective maximum, so the results for the 6 µm-diameter sphere cover a larger area. Tabulated deterministic solutions published by Goldman et al. are shown as triangles (6 µm-diameter sphere) and circles (10 µm-diameter sphere). Although agreement was good, the simulation slightly underpredicted the superposition result. (D) Time-domain flow-directed instantaneous velocity for a 6 µm-diameter sphere (maroon line), flow-directed instantaneous velocity for a 10 µm-diameter sphere (red line), gap size for a 6 µm-diameter sphere (dark blue line), and gap size for a 10 µm-diameter sphere (light blue line) are shown. The low-frequency fluctuations in the instantaneous velocity reflected fluctuations in the gap.
Figure 4
Figure 4. Reactive microsphere motion illustrates the discrete nature of bond formation events and force loading.
Reactive spheres were simulated with S = 50 s−1, nL° = 100 sites/µm2, nR° = 50 sites/µm2, association kinetics governed by (1), and dissociation kinetics governed by (3). (A) Results for a 6 µm-diameter sphere with a rope model of bond deformation, (5). Sampled flow-direction velocity (VS,X, red), perpendicular velocity (VS,Y, maroon), gap size (dark blue) and number of bonds (light blue) are shown. (B) Results for a 6 µm-diameter sphere with a freely-jointed chain model of force deformation, (6). An increase in the magnitude of the fluctuations of VS,X was observed with the decrease in stiffness relative to (A). (C) Results for a 10 µm-diameter sphere with a freely-jointed chain model of force deformation, (6). The motion was higher frequency in nature with shorter pauses and more frequent pause events. (D) A comparison of simulated bond loadings for the rope tether results in (A), top, and the freely-jointed chain in (B), bottom. Each sampled point on the inset is spaced by 1 ms. In both cases, the sphere's pause tended to be supported by a singly-loaded bond. The decreased stiffness of the freely-jointed chain tether resulted in a smaller standard deviation of the supported force. A lower maximum initial force loading was predicted for the freely-jointed chain model than for the rope model (insets).
Figure 5
Figure 5. Loading patterns demonstrate how bond forces influence sphere motion.
Reactive spheres were simulated with nL° = 100 sites/µm2, nR° = 50 sites/µm2, association kinetics governed by (1), and dissociation kinetics governed by (3). Note that the step function in the freely-jointed chain model, (6), resulted in a step from zero force to 56 pN as the tether extended past 92 nm, and then force continued to increase continuously. (A) A sample of bond loading data for 6 µm-diameter spheres with a 50 s−1 wall shear rate. (B) Results from a simulation for 6 µm-diameter spheres with a 100 s−1 wall shear rate. Note that bonds were aligned to their respective initial loading points in the figure, so the total instantaneous force exerted by the concurrent bonds, shown by the green and blue tracings, on the sphere cannot be calculated by summing the two values at the same time point on the plot. (C) Bond loading results from a 10 µm-diameter sphere at a 100 s−1 wall shear rate. Of the three cases, the larger sphere had the most bond loading events and also was the most likely to form simultaneous hydrodynamic force bearing bonds. (D) Loading trajectories for single, force-bearing bonds. Data were compiled from simulation runs for 10 µm-diameter spheres with a 100 s−1 wall shear rate. Individual tracings represent individual bond events, with position coordinates representing the position of the bond tether point on the sphere relative to the center, projected onto the XY plane. The color depicts the force on the bond. The black circle illustrates the expected contact patch for unstressed bonds when the sphere touches the wall to within the limits of the assumed roughness. Single bonds only supported minimal force initially, evident in the first 5 ms of loading in (C), but could only cause the sphere to wobble once the tether point exited the contact patch, apparent in (D).
Figure 6
Figure 6. Peak loading characteristics for single bonds.
Simulation results for 6 µm-diameter spheres with a 50 s−1 (grey) and 100 s−1 (dark grey) wall shear rate and for 10 µm-diameter spheres with a 50 s−1 (white) and 100 s−1 (black) wall shear rate were screened for single bond loading events. (A) Statistical compilation of mean peak single bond loading forces. The error bar depicts the standard deviation. (B) Statistical compilation of peak loading rates. The error bar depicts the standard deviation.
Figure 7
Figure 7. High temporal resolution comparison of simulation results to the data of Park et al.
. Experiments and simulations were performed with S = 50 s−1, R = 4.9 µm, nL° = 90 sites/µm2, and nR° = 95 sites/µm2. The sampled flow-direction velocity (VS,X, blue) and the sampled perpendicular velocity (VS,Y, green). (A) Results for an experimental microbead using the original sum-of-absolute-differences tracking algorithm. (B) The same experimental microbead was tracked using the centroid-based MCShape algorithm. (C) Tracking results using MCShape for an apparently non-interacting experimental microbead in the same video segment. (D) Simulation results using the Bell slip bond model, (3), dissociation parameters from Park et al. . The comparison demonstrates the model recreates microbead motions well to a first approximation. (E) Simulation results using catch-slip model, (4), dissociation parameters from the discussion of the biomembrane force probe results by Evans et al. . The results demonstrate that if the parameters discussed by Evans et al. are true measures of monomeric bond dissociation under force, they would be difficult to detect by a pause time analysis of flow cell assay data.
Figure 8
Figure 8. Pauses primarily affected by clustering but skips primarily sensitive to available binding pockets.
Reactive spheres were simulated with S = 50 s−1, R = 4.9 µm, nL° = 90 sites/µm2, 1×nR° = 95 sites/µm2, conditions similar to the experiment of Park et al. . Association kinetics were governed by (1) or (2). The catch-slip dissociation model, (4), was used employing parameters regressed from the flow-cell data of Marshall et al. , for dimeric interactions. Increased valency, V, was achieved for each receptor cluster site by using reliability theory rules to create load-sharing molecular clusters. Therefore, 2×V might physically correspond to a tetrameric bond cluster. The black lines show the fit parameters reported in Table S1 and the dots show data points from the simulation. The percentile, “P,” indicates the uniform order statistic median. Each data set was pooled from three 10 s simulation runs. Blue: single valence receptor clusters with contact patch confinement. Red: single valence receptor clusters with molecular area confinement. Dark blue: double-valence receptor clusters with contact patch confinement. Maroon: double-valence receptor clusters with molecular area confinement. Green: single valence receptor clusters but with double the receptor cluster site density and contact patch confinement. Gold: single valence receptor clusters but with double the receptor cluster site density and molecular area confinement. (A) Non-transformed pause time data. (B) Non-transformed skip distance data. (C) Linear transform for Poisson-distributed pause times. (D) Linear transform for Poisson-distributed skip distances shows two distinct regions.
Figure 9
Figure 9. Long-skip distances and wobble differentially reflect molecular activity.
Reactive spheres were simulated with S = 50 s−1, R = 4.9 µm, 1×nL° = 90 sites/µm2, and nR° = 95 sites/µm2. Association kinetics were governed by (1) or (2). Catch-slip parameters regressed from Marshall et al. , were used in the catch-slip model, (4), or the just the high-impedance pathway parameters were entered into the slip model, (3). (A) The long-skip distance calculated from the two-parameter Poisson regression at a variety of ligand concentrations. Black circles: the catch-slip model was assumed with contact patch confinement. Blue triangles: the catch-slip model was assumed with molecular area confinement. Red squares: the slip model was assumed with contact patch confinement. Green diamonds: the slip model was assumed with molecular area confinement. Error bars show the 95% confidence interval estimate from the nonlinear regression. Surprisingly, the dissociation model had a moderate effect on the skip distance at low site densities but the confinement model had little effect. (B) The sample-normalized autocorrelation of the velocity component perpendicular to the flow direction (wobble velocity autocorrelation) was calculated and averaged together for the three simulated beads at each condition. The colors indicate the same reaction assumptions as in the previous graph. Heavy dashed lines: results from 4×90 sites/µm2 ligand density. Intermediate dot-dashed lines: results from 1×90 sites/µm2 ligand density. Light solid lines: results from ½×90 sites/µm2 ligand density. Colors represent the same cases as in (A). The confinement model had the largest effect on the wobble autocorrelation.
Figure 10
Figure 10. Molecular capture spans the gap and enhances recapture events.
The simulation results from Figure 9 were pooled to obtain 60 events for each capture bond. (A) An analysis was conducted to investigate the separation of the sphere from the surface when bonds form in the absence of pre-existing bonds. First capture bonds formed efficiently across the range of gap sizes. Solid black line: equilibrium distribution for the gap size. Red circles: distribution of separation distances when the first bond formation event occurs. Green diamonds: distribution of separation distances observed when the first recapture, e.g. second capture, bond forms. Blue dashed line with triangles: distribution of separation distances when the second recapture, e.g. third capture, bond forms. (B) Once the sphere captured to the surface once, the first and second recapture bonds formed more quickly. The characteristic binding times describing the first linear segment (inset) for the initial capture bond, the first recapture bond, and the second recapture bond were 0.143 s, 0.081 s, and 0.085 s, respectively.

Similar articles

Cited by

References

    1. Bell GI. Models for the specific adhesion of cells to cells. Science. 1978;200:618–627. - PubMed
    1. Lawrence MB. Selectin-carbohydrate interactions in shear flow. Curr Opin Chem Biol. 1999;3:659–664. - PubMed
    1. Lin J, Miller MJ, Shaw AS. The c-SMAC: sorting it all out (or in). J Cell Biol. 2005;170:177–182. - PMC - PubMed
    1. Thomas WE, Trintchina E, Forero M, Vogel V, Sokurenko EV. Bacterial adhesion to target cells enhanced by shear force. Cell. 2002;109:913–923. - PubMed
    1. Marshall BT, Long M, Piper JW, Yago T, McEver RP, et al. Direct observation of catch bonds involving cell-adhesion molecules. Nature. 2003;423:190–193. - PubMed

Publication types