

Model of transcriptional activation by MarA in Escherichia coli
- PMID: 20019803
- PMCID: PMC2787020
- DOI: 10.1371/journal.pcbi.1000614
Model of transcriptional activation by MarA in Escherichia coli
Abstract
The AraC family transcription factor MarA activates approximately 40 genes (the marA/soxS/rob regulon) of the Escherichia coli chromosome resulting in different levels of resistance to a wide array of antibiotics and to superoxides. Activation of marA/soxS/rob regulon promoters occurs in a well-defined order with respect to the level of MarA; however, the order of activation does not parallel the strength of MarA binding to promoter sequences. To understand this lack of correspondence, we developed a computational model of transcriptional activation in which a transcription factor either increases or decreases RNA polymerase binding, and either accelerates or retards post-binding events associated with transcription initiation. We used the model to analyze data characterizing MarA regulation of promoter activity. The model clearly explains the lack of correspondence between the order of activation and the MarA-DNA affinity and indicates that the order of activation can only be predicted using information about the strength of the full MarA-polymerase-DNA interaction. The analysis further suggests that MarA can activate without increasing polymerase binding and that activation can even involve a decrease in polymerase binding, which is opposite to the textbook model of activation by recruitment. These findings are consistent with published chromatin immunoprecipitation assays of interactions between polymerase and the E. coli chromosome. We find that activation involving decreased polymerase binding yields lower latency in gene regulation and therefore might confer a competitive advantage to cells. Our model yields insights into requirements for predicting the order of activation of a regulon and enables us to suggest that activation might involve a decrease in polymerase binding which we expect to be an important theme of gene regulation in E. coli and beyond.
Conflict of interest statement
The authors have declared that no competing interests exist.
Figures
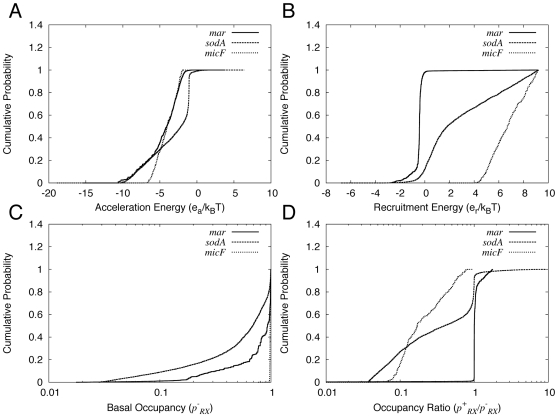
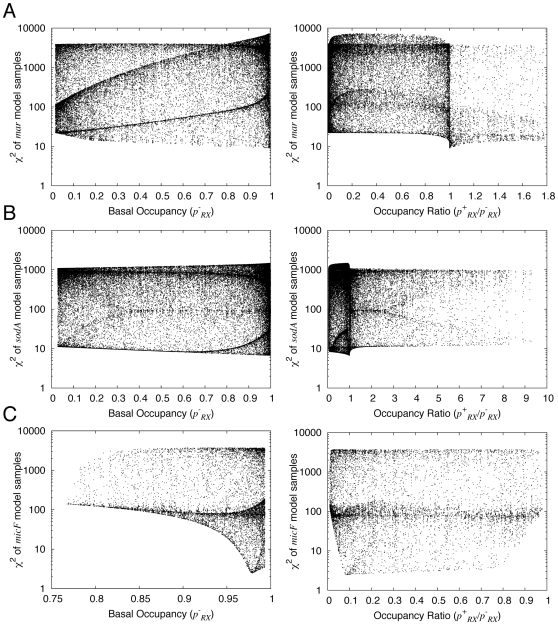
 ) and right panels plot the occupancy ratio (
 ) on the x-axis. Parameter values were sampled as for Fig. 3, using the nominal values in Table 1.
Similar articles
-
A comprehensive alanine scanning mutagenesis of the Escherichia coli transcriptional activator SoxS: identifying amino acids important for DNA binding and transcription activation.J Mol Biol. 2002 Sep 13;322(2):237-57. doi: 10.1016/s0022-2836(02)00782-9. J Mol Biol. 2002. PMID: 12217688
-
Activation of the Escherichia coli marA/soxS/rob regulon in response to transcriptional activator concentration.J Mol Biol. 2008 Jul 4;380(2):278-84. doi: 10.1016/j.jmb.2008.05.015. Epub 2008 May 13. J Mol Biol. 2008. PMID: 18514222 Free PMC article.
-
Characterization of TetD as a transcriptional activator of a subset of genes of the Escherichia coli SoxS/MarA/Rob regulon.Mol Microbiol. 2005 May;56(4):1103-17. doi: 10.1111/j.1365-2958.2005.04599.x. Mol Microbiol. 2005. PMID: 15853893
-
The Escherichia coli multiple antibiotic resistance activator protein represses transcription of the lac operon.Biochem Soc Trans. 2019 Apr 30;47(2):671-677. doi: 10.1042/BST20180498. Epub 2019 Mar 8. Biochem Soc Trans. 2019. PMID: 30850424 Review.
-
The AraC transcriptional activators.Curr Opin Microbiol. 2001 Apr;4(2):132-7. doi: 10.1016/s1369-5274(00)00178-8. Curr Opin Microbiol. 2001. PMID: 11282467 Review.
Cited by
-
Phenotypic and Genetic Analysis of KPC-49, a KPC-2 Variant Conferring Resistance to Ceftazidime-Avibactam and Maintaining Resistance to Imipenem and Meropenem.Infect Drug Resist. 2023 Apr 27;16:2477-2485. doi: 10.2147/IDR.S406319. eCollection 2023. Infect Drug Resist. 2023. PMID: 37138840 Free PMC article.
-
Tunable stochastic pulsing in the Escherichia coli multiple antibiotic resistance network from interlinked positive and negative feedback loops.PLoS Comput Biol. 2013;9(9):e1003229. doi: 10.1371/journal.pcbi.1003229. Epub 2013 Sep 26. PLoS Comput Biol. 2013. PMID: 24086119 Free PMC article.
-
Operator sequence alters gene expression independently of transcription factor occupancy in bacteria.Cell Rep. 2012 Jul 26;2(1):150-61. doi: 10.1016/j.celrep.2012.06.004. Epub 2012 Jul 12. Cell Rep. 2012. PMID: 22840405 Free PMC article.
-
Deconstructing a multiple antibiotic resistance regulation through the quantification of its input function.NPJ Syst Biol Appl. 2017 Oct 6;3:30. doi: 10.1038/s41540-017-0031-2. eCollection 2017. NPJ Syst Biol Appl. 2017. PMID: 29018569 Free PMC article.
-
A New Way of Sensing: Need-Based Activation of Antibiotic Resistance by a Flux-Sensing Mechanism.mBio. 2015 Jul 21;6(4):e00975. doi: 10.1128/mBio.00975-15. mBio. 2015. PMID: 26199330 Free PMC article.
References
-
- Martinez-Antonio A, Collado-Vides J. Identifying global regulators in transcriptional regulatory networks in bacteria. Curr Opin Microbiol. 2003;6:482–489. - PubMed
-
- Shen-Orr SS, Milo R, Mangan S, Alon U. Network motifs in the transcriptional regulation network of Escherichia coli. Nat Genet. 2002;31:64–68. - PubMed
-
- White DG, Alekshun MN, McDermott PF. Frontiers in Antimicrobial Resistance. Washington, DC: ASM Press; 2005.
-
- Martin RG, Gillette WK, Rhee S, Rosner JL. Structural requirements for marbox function in transcriptional activation of mar/sox/rob regulon promoters in Escherichia coli: sequence, orientation and spatial relationship to the core promoter. Mol Microbiol. 1999;34:431–441. - PubMed
Publication types
MeSH terms
Substances
Grants and funding
LinkOut - more resources
Full Text Sources
Molecular Biology Databases
