

Adaptive gain modulation in V1 explains contextual modifications during bisection learning
- PMID: 20019808
- PMCID: PMC2788217
- DOI: 10.1371/journal.pcbi.1000617
Adaptive gain modulation in V1 explains contextual modifications during bisection learning
Abstract
The neuronal processing of visual stimuli in primary visual cortex (V1) can be modified by perceptual training. Training in bisection discrimination, for instance, changes the contextual interactions in V1 elicited by parallel lines. Before training, two parallel lines inhibit their individual V1-responses. After bisection training, inhibition turns into non-symmetric excitation while performing the bisection task. Yet, the receptive field of the V1 neurons evaluated by a single line does not change during task performance. We present a model of recurrent processing in V1 where the neuronal gain can be modulated by a global attentional signal. Perceptual learning mainly consists in strengthening this attentional signal, leading to a more effective gain modulation. The model reproduces both the psychophysical results on bisection learning and the modified contextual interactions observed in V1 during task performance. It makes several predictions, for instance that imagery training should improve the performance, or that a slight stimulus wiggling can strongly affect the representation in V1 while performing the task. We conclude that strengthening a top-down induced gain increase can explain perceptual learning, and that this top-down signal can modify lateral interactions within V1, without significantly changing the classical receptive field of V1 neurons.
Conflict of interest statement
The authors have declared that no competing interests exist.
Figures
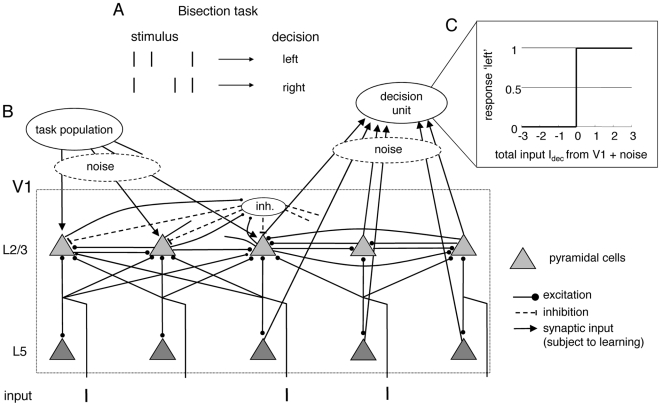
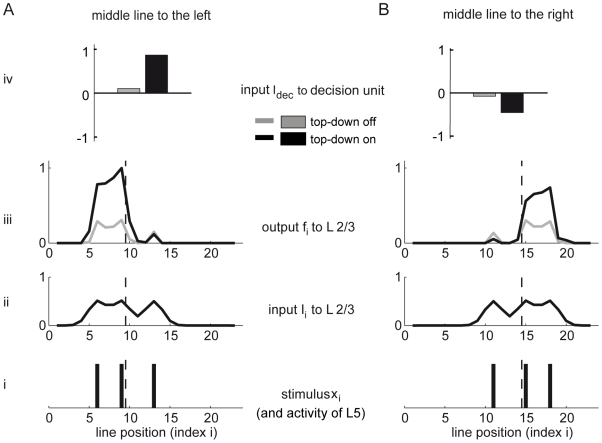
 , is a weighted sum of the noisy L2/3 and L5 activities without (grey) and with (black) top-down input, upon which the decision ‘left’ or ‘right’ is made by thresholding at
  . The weak gain increase (by a factor of
  ) dramatically increases the signal (by a factor of
  and
and  , respectively). The plots show averaged activities over
  runs with the same stimulus configurations.
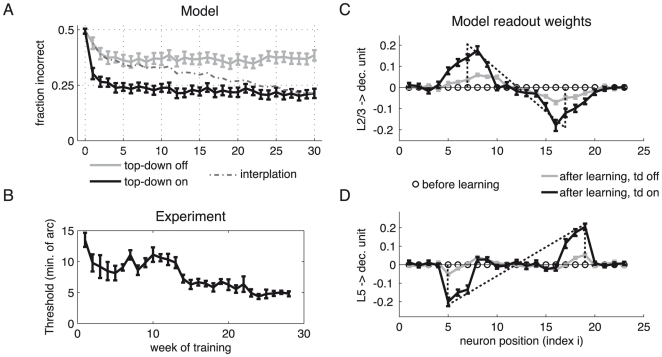
 bisection stimuli of fixed outer-line-distance (‘width’) but with randomized positions. Upon each stimulus presentation, the readout weights from the L5 and the L2/3 pyramidal neurons to the decision unit were changed according to an error correcting learning rule. A top-down induced gain increase in the L2/3 pyramidal neurons reduces the error level (grey: gain factor
  ; black: gain factor
  ). Hence, a substantial improvement in performance is achieved if learning simultaneously increases the top-down input strength, leading to a learning curve which interpolates between the two curves (dashed line). The fast initial learning progress arises from adapting the readout connections to the decision unit. (B) Learning curve for a monkey performing the bisection task (adapted from [10]). (C) Synaptic weights from L2/3 pyramidal neurons to the decision unit before (circles) and after learning with (black) and without gain increase (grey). The dotted line indicates the universal weight distribution inferred in the theoretical argument. (D) Same as in C, but for synaptic weights from L5 pyramidal neurons to the decision unit. Error bars represent standard error of the mean (using
  learning runs).
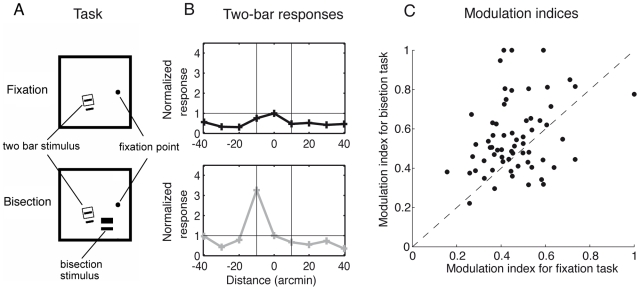
 . Top: During pure fixation or before training (modeled by a non-modulated circuitry, gain
  ), the response of the central neuron is suppressed by the flanking line via global inhibition. Bottom: When performing the bisection task at a nearby location in the trained hemisphere (modeled by a top-down induced gain increase of the L2/3 pyramidal neurons from
  to
to  ) the lateral suppression turns into strong excitation at random positions due to the enhanced competition within the stochastically modulated network. (C) Modulation indices for the ‘bisection task’ (gain
  ) versus ‘fixation task’ (gain
  ). The modulation index is defined as the normalized difference between the maximal and minimal response of the recorded L2/3 pyramidal neuron, each evaluated for the different positions of the flanking line (as represented in B, see Materials and Methods). Evaluation for neurons in
  stochastic network configurations shows that the modulation index under the bisection condition is significantly larger than under the fixation condition (
 for paired t-test with
  ), as it is also observed in the experiment ( with
  ,
,  ,
,  ).
).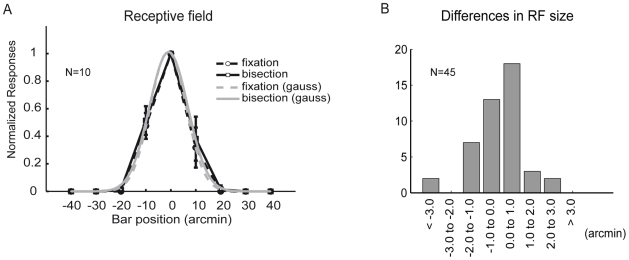
 , dashed line) and with a top-down induced gain increase of the L2/3 pyramidal neurons (‘bisection task’, gain
  , solid line). Grey lines show Gaussian fits (with
  and
and  for the fixation and the bisection task, respectively). Error bars arise from the stochasticity in the top-down induced gain modulation (
 line presentations at each position with fixed network configuration). (B) Histogram of the differences in the receptive field (RF) size of
  model pyramidal neurons under bisection versus fixation conditions. For comparison with the experiment where the same number of neurons were recorded from different positions and animals, we extracted the model neurons from
  different network configurations and determined the receptive field as in A. The difference in the receptive field size was not significant (
 in the t-test with
  ), in agreement with the experimental findings (, with
  ,
,  ,
,  ). However, increasing the number of sample neurons may turn a non-significant into a significant result, and for the model this is in fact the case, with RF size during the bisection task becoming significantly (in terms of the t-test) smaller by
  than without performing this task.
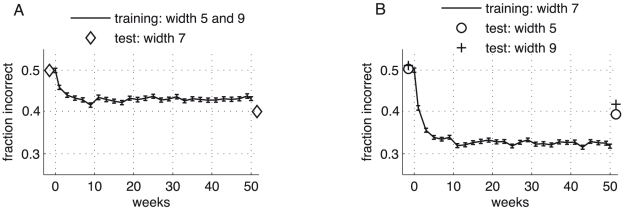
 and
and  ) which were randomly interleaved (‘roving’). In agreement with recent findings – but unlike previous predictions , – learning under stimulus roving is impaired, although still possible (the final fraction of incorrect responses, being
  for stimulus roving, is reduced for individual training of the bisection width 5 and 9 to
  and
and  , respectively). Note that the post-training test shows a better performance for the interpolated width
  which was itself not trained. (B) Learning curve for bisection stimuli of width
  (line), with pre- and post-learning tests for the untrained stimulus widths
  and
and  . A learning transfer of roughly
  from the trained to the two untrained widths is predicted by the model. Error bars represent the standard error of the mean evaluated for
  runs.
runs.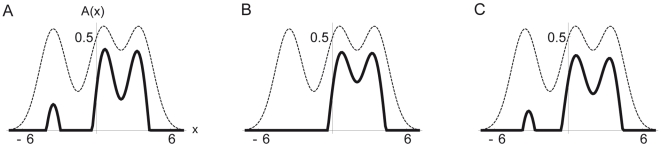
 (dashed lines) and bisection stimulus with lines positions at
  ,
,  and
and  , are the same as in Figure 2B. The width of the recurrent projections (
 ) varies for the three sub panels: (A)
  , (B)
, (B)  and (C)
  . Symmetry breaking is strongest if
  is roughly half the bisection width (B, corresponding to the parameter choice in the discrete simulations). For smaller and larger
  (A and C), the activity to the left bisection line is not fully suppressed and the distribution is less asymmetric (as expressed by a smaller first order moment
  , taking on values
  ,
,  and
and  from left to right).
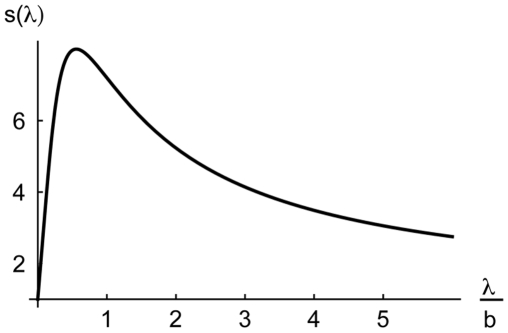
 describes the shift in the center of gravity of the L2/3 steady state activity when displacing the middle bisection line away from the bisection center (Eq. 14). Parameter values:
  , and the same values
  ,
,  , and
, and  as in the other simulations. The maximum of
  is at
is at  , confirming that (for a nonlinear suppression parameter
  between
  and roughly
  ) the optimal recurrent projection width (
 ) is in the range of the half width of the bisection stimulus (
 ).
).Similar articles
-
Perceptual learning via modification of cortical top-down signals.PLoS Comput Biol. 2007 Aug;3(8):e165. doi: 10.1371/journal.pcbi.0030165. PLoS Comput Biol. 2007. PMID: 17715996 Free PMC article.
-
A neural mechanism of dynamic gating of task-relevant information by top-down influence in primary visual cortex.Biosystems. 2016 Dec;150:138-148. doi: 10.1016/j.biosystems.2016.09.009. Epub 2016 Sep 28. Biosystems. 2016. PMID: 27693625
-
Network model of top-down influences on local gain and contextual interactions in visual cortex.Proc Natl Acad Sci U S A. 2013 Oct 22;110(43):E4108-17. doi: 10.1073/pnas.1317019110. Epub 2013 Oct 7. Proc Natl Acad Sci U S A. 2013. PMID: 24101495 Free PMC article.
-
Interactions between attention, context and learning in primary visual cortex.Vision Res. 2000;40(10-12):1217-26. doi: 10.1016/s0042-6989(99)00234-5. Vision Res. 2000. PMID: 10788637 Review.
-
Perceptual learning: is V1 up to the task?Curr Biol. 2004 Aug 24;14(16):R671-3. doi: 10.1016/j.cub.2004.08.016. Curr Biol. 2004. PMID: 15324688 Review.
Cited by
-
Acetylcholine Mediates Dynamic Switching Between Information Coding Schemes in Neuronal Networks.Front Syst Neurosci. 2019 Nov 12;13:64. doi: 10.3389/fnsys.2019.00064. eCollection 2019. Front Syst Neurosci. 2019. PMID: 31780905 Free PMC article.
-
Phasic and tonic patterns of locus coeruleus output differentially modulate sensory network function in the awake rat.J Neurophysiol. 2011 Jan;105(1):69-87. doi: 10.1152/jn.00445.2010. Epub 2010 Oct 27. J Neurophysiol. 2011. PMID: 20980542 Free PMC article.
References
-
- Douglas R, Koch C, Mahowald M, Martin K, Suarez H. Recurrent excitation in neocortical circuits. Science. 1995;160:981–5. - PubMed
-
- Angelucci A, Bressloff P. Contribution of feedforward, lateral and feedback connections to the classical receptive field center and extra-classical receptive field surround of primate V1 neurons. Prog Brain Res. 2006;154:93–120. - PubMed
-
- Kapadia M, Ito M, Gilbert C, Westheimer G. Improvement in visual sensitivity by changes in local context: parallel studies in human observers and in v1 of alert monkeys. Neuron. 1995;15:843–56. - PubMed
-
- Ito M, Westheimer G, Gilbert C. Attention and perceptual learning modulate contextual influences on visual perception. Neuron. 1998;20:1191–97. - PubMed
