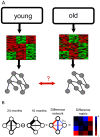
Aging mice show a decreasing correlation of gene expression within genetic modules
- PMID: 20019809
- PMCID: PMC2788246
- DOI: 10.1371/journal.pgen.1000776
Aging mice show a decreasing correlation of gene expression within genetic modules
Abstract
In this work we present a method for the differential analysis of gene co-expression networks and apply this method to look for large-scale transcriptional changes in aging. We derived synonymous gene co-expression networks from AGEMAP expression data for 16-month-old and 24-month-old mice. We identified a number of functional gene groups that change co-expression with age. Among these changing groups we found a trend towards declining correlation with age. In particular, we identified a modular (as opposed to uniform) decline in general correlation with age. We identified potential transcriptional mechanisms that may aid in modular correlation decline. We found that computationally identified targets of the NF-KappaB transcription factor decrease expression correlation with age. Finally, we found that genes that are prone to declining co-expression tend to be co-located on the chromosome. Our results conclude that there is a modular decline in co-expression with age in mice. They also indicate that factors relating to both chromosome domains and specific transcription factors may contribute to the decline.
Conflict of interest statement
The authors have declared that no competing interests exist.
Figures


 and
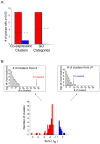
and  . Again the red bars indicate decreasing co-expression, and the blue bars indicate increasing co-expression. Top left panel: The total number of groups that decrease in co-expression exceeds any of the
  permuted values. Top right panel: The total number of groups that decrease in co-expression exceeds all but 4/1,000 of the permuted values.

 ) versus the connectivity (
 ) after simulation of uniform co-expression loss. Each dot represents a probe in either the 16-month-old (blue) and 24-month-old (red) networks. All of the probes with at least one neighbor are plotted. The gray lines represent the 100 node-deletion simulations. (B) The clustering coefficient (
 ) versus the connectivity (
 ) for young and old mice as contrasted with the cluster-based deletion simulation. Each dot represents a probe in either the 16-month-old (blue) and 24-month-old (red) networks. All of the probes with at least one neighbor are plotted. The distributions from the cluster-based deletion simulations are shown in gray.

 are counted. (B) The positions of genes are plotted on the chromosome. The black bars are genes that do not meet the loss score threshold. Genes with a high loss score (red bars) were found to be clustered together.
Similar articles
-
Co-expression network analysis identified hub genes critical to triglyceride and free fatty acid metabolism as key regulators of age-related vascular dysfunction in mice.Aging (Albany NY). 2019 Sep 12;11(18):7620-7638. doi: 10.18632/aging.102275. Epub 2019 Sep 12. Aging (Albany NY). 2019. PMID: 31514170 Free PMC article.
-
AGEMAP: a gene expression database for aging in mice.PLoS Genet. 2007 Nov;3(11):e201. doi: 10.1371/journal.pgen.0030201. Epub 2007 Oct 2. PLoS Genet. 2007. PMID: 18081424 Free PMC article.
-
Identification of regulatory modules in genome scale transcription regulatory networks.BMC Syst Biol. 2017 Dec 15;11(1):140. doi: 10.1186/s12918-017-0493-2. BMC Syst Biol. 2017. PMID: 29246163 Free PMC article.
-
Transcriptomic landscape, gene signatures and regulatory profile of aging in the human brain.Biochim Biophys Acta Gene Regul Mech. 2020 Jun;1863(6):194491. doi: 10.1016/j.bbagrm.2020.194491. Epub 2020 Feb 8. Biochim Biophys Acta Gene Regul Mech. 2020. PMID: 32006715
-
Harnessing the power of gene microarrays for the study of brain aging and Alzheimer's disease: statistical reliability and functional correlation.Ageing Res Rev. 2005 Nov;4(4):481-512. doi: 10.1016/j.arr.2005.06.006. Epub 2005 Oct 27. Ageing Res Rev. 2005. PMID: 16257272 Review.
Cited by
-
A mammalian pseudogene lncRNA at the interface of inflammation and anti-inflammatory therapeutics.Elife. 2013 Jul 23;2:e00762. doi: 10.7554/eLife.00762. Elife. 2013. PMID: 23898399 Free PMC article.
-
Multi-level remodeling of transcriptional landscapes in aging and longevity.BMB Rep. 2019 Jan;52(1):86-108. doi: 10.5483/BMBRep.2019.52.1.296. BMB Rep. 2019. PMID: 30526773 Free PMC article. Review.
-
Aging at Evolutionary Crossroads: Longitudinal Gene Co-expression Network Analyses of Proximal and Ultimate Causes of Aging in Bats.Mol Biol Evol. 2022 Jan 7;39(1):msab302. doi: 10.1093/molbev/msab302. Mol Biol Evol. 2022. PMID: 34662394 Free PMC article.
-
Life spanning murine gene expression profiles in relation to chronological and pathological aging in multiple organs.Aging Cell. 2013 Oct;12(5):901-909. doi: 10.1111/acel.12118. Epub 2013 Jul 14. Aging Cell. 2013. PMID: 23795901 Free PMC article.
-
Integrating cellular senescence with the concept of damage accumulation in aging: Relevance for clearance of senescent cells.Aging Cell. 2019 Feb;18(1):e12841. doi: 10.1111/acel.12841. Epub 2018 Oct 22. Aging Cell. 2019. PMID: 30346102 Free PMC article. Review.
References
-
- Zahn JM, Sonu R, Vogel H, Crane E, Mazan-Mamczarz K, et al. Transcriptional profiling of aging in human muscle reveals a common aging signature. PLoS Genet. 2006;2:e115. doi: 10.1371/journal.pgen.0020115. - DOI - PMC - PubMed
-
- Hughes TR, Marton MJ, Jones AR, Roberts CJ, Stoughton R, et al. Functional discovery via a compendium of expression profiles. Cell. 2000;102:109–26. - PubMed
-
- Butte AJ, Kohane IS. Mutual information relevance networks: functional genomic clustering using pairwise entropy measurements. Pacific Symposium on Biocomputing. 2000;5:415–426. - PubMed
-
- Kim SK, Lund J, Kiraly M, Duke K, Jiang M, et al. A gene expression map for Caenorhabditis elegans. Science. 2001;293:2087–92. - PubMed
-
- Jordan IK, Mariño-Ramrez L, Wolf YI, Koonin EV. Conservation and coevolution in the scale-free human gene coexpression network. Molecular Biology and Evolution. 2004;21:2058–70. - PubMed
Publication types
MeSH terms
Substances
Grants and funding
LinkOut - more resources
Full Text Sources
Other Literature Sources
Medical

