. 2009 Dec 17;4(12):e8340.
doi: 10.1371/journal.pone.0008340.

Global demethylation of rat chondrosarcoma cells after treatment with 5-aza-2'-deoxycytidine results in increased tumorigenicity

Affiliations

Global demethylation of rat chondrosarcoma cells after treatment with 5-aza-2'-deoxycytidine results in increased tumorigenicity

Christopher A Hamm et al. PLoS One. .

Abstract

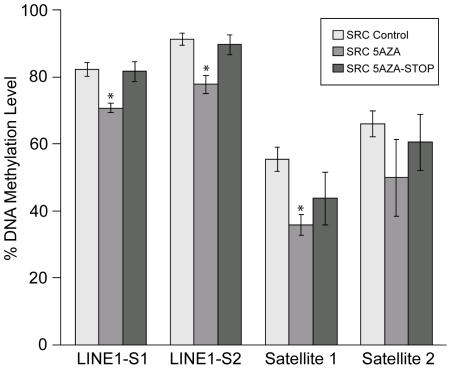
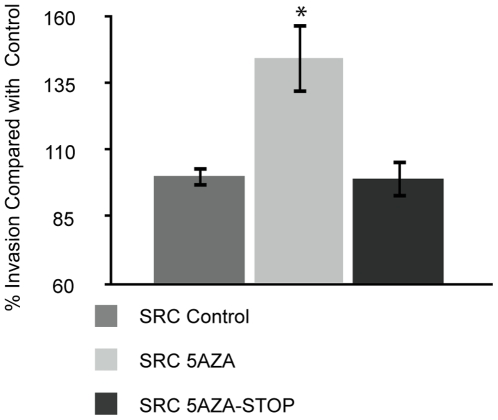
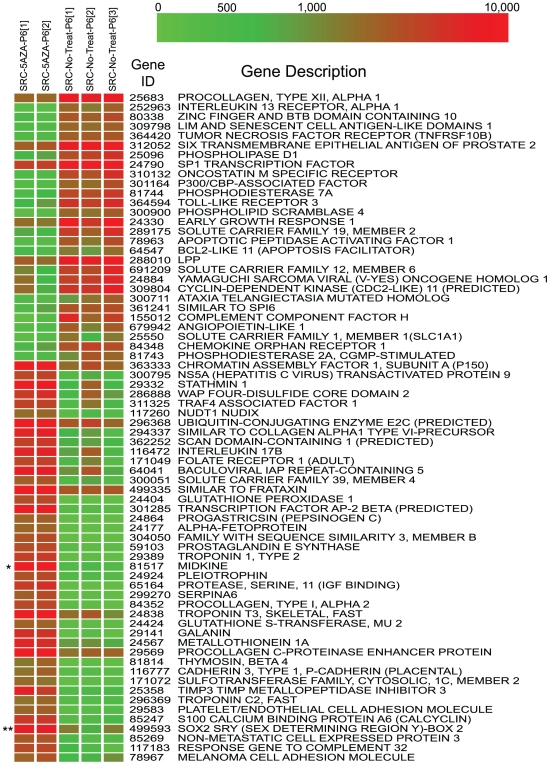
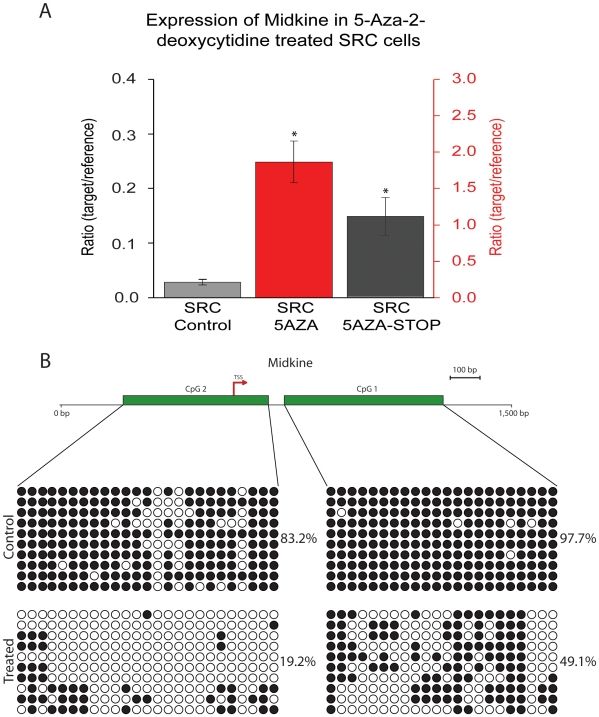
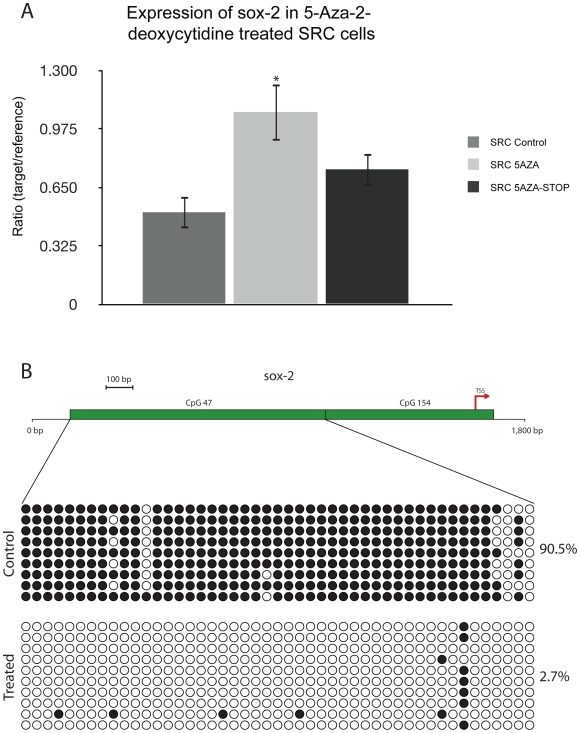
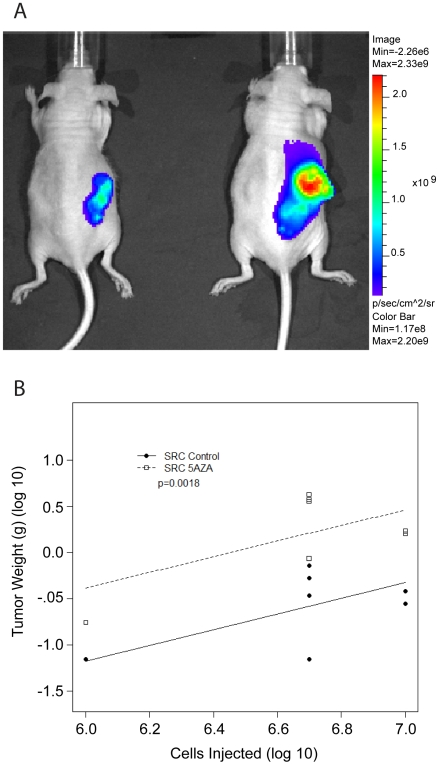
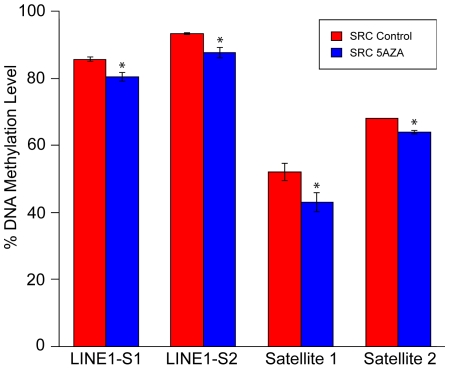
Abnormal patterns of DNA methylation are observed in several types of human cancer. While localized DNA methylation of CpG islands has been associated with gene silencing, the effect that genome-wide loss of methylation has on tumorigenesis is not completely known. To examine its effect on tumorigenesis, we induced DNA demethylation in a rat model of human chondrosarcoma using 5-aza-2-deoxycytidine. Rat specific pyrosequencing assays were utilized to assess the methylation levels in both LINEs and satellite DNA sequences following 5-aza-2-deoxycytidine treatment. Loss of DNA methylation was accompanied by an increase in invasiveness of the rat chondrosarcoma cells, in vitro, as well as by an increase in tumor growth in vivo. Subsequent microarray analysis provided insight into the gene expression changes that result from 5-aza-2-deoxycytidine induced DNA demethylation. In particular, two genes that may function in tumorigenesis, sox-2 and midkine, were expressed at low levels in control cells but upon 5-aza-2-deoxycytidine treatment these genes became overexpressed. Promoter region DNA analysis revealed that these genes were methylated in control cells but became demethylated following 5-aza-2-deoxycytidine treatment. Following withdrawal of 5-aza-2-deoxycytidine, the rat chondrosarcoma cells reestablished global DNA methylation levels that were comparable to that of control cells. Concurrently, invasiveness of the rat chondrosarcoma cells, in vitro, decreased to a level indistinguishable to that of control cells. Taken together these experiments demonstrate that global DNA hypomethylation induced by 5-aza-2-deoxycytidine may promote specific aspects of tumorigenesis in rat chondrosarcoma cells.


Conflict of interest statement

Competing Interests: The authors have declared that no competing interests exist.

Figures

Figure 1
Figure 1. Pyrosequencing of LINE and Satellite 1 and 2 in vitro.
For each experiment the methylation pattern was analyzed in SRC untreated control cells (SRC-Control), SRC cells treated with 5-Aza-2-deoxycytidine for 5 passages (SRC 5AZA), and in SRC cells that were treated with 5-Aza-2-deoxycytidine for 5 passages and then allowed to grow for 5 additional passages without treatment (SRC 5AZA-STOP). Pyrosequencing assay: LINE1-S1; [2481 CpG's], LINE1-S2; [3308 CpG's]; Satellite I [15CpG's], and Satellite II [411 CpG's]. Treatment of MSCV3-LTC chondrosarcoma cells with 5-Aza-2-deoxycytidine leads to demethylation that can be detected throughout the genome. Altered DNA methylation patterns can be detected several weeks following removal of 5-Aza-2-deoxycytidine treatment. Bars represent the average DNA methylation % of three biologic replicates, and error bars represent the standard deviation of these replicates. ‘*’ Indicates values that are significantly different than the “SRC Control” sample (p<.05).
Figure 2
Figure 2. 5-Aza-2-deoxycytidine treatment increases the invasiveness of rat chondrosarcoma cells.
Invasiveness was measured in control SRC cells (SRC Control), SRC cells that were treated for 5 passages with 5-Aza-2-deoxycytidine (SRC 5AZA), and SRC cells 5-with 5 passages Aza-2-deoxycytidine and then grown for 5 additional passages without treatment (5AZA-STOP). The invasiveness was calculated for all samples and the results are displayed as experimental sample compared to the untreated control SRC cells (100% invasion). The bar represents the average invasion indices of three biologic replicates, and the error bars represent the standard deviation of the biologic replicates. ‘*’ Indicates values that are significantly different than the “SRC Control” sample (p<.05).
Figure 3
Figure 3. Heat map of differentially expressed genes between SRC cells treated 5-Aza-2-deoxycytidine and untreated control SRC cells.
Genes with at least a 5-fold difference were selected for analysis using the pathway program Ingenuity. Ingenuity revealed that, of the 977 differentially expressed genes (603 genes upregulated and 374 downregulated), 135 were identified as cancer related. A subset of these cancer related genes (see Materials and Methods; see Table S3 for complete gene list and expression values) was then used for hierarchical clustering, and the results of that clustering are presented in this figure. Each vertical column represents microarray hybridizations from separate individual experiments. Microarray hybridizations were carried out on SRC cells treated with 5-Aza-2-deoxycytidine for 5 passages (SRC-5-AZA-P6 and [2]), and microarray hybridizations were also carried out on SRC cells grown for 5 passages without 5-Aza-2-deoxycytidine treatment (SRC-No-Treat-P6 , , and [3]). ‘*’ Indicates midkine and ‘**’ indicates sox-2 in the heat map. The color bar corresponds the to the expression level in relative fluorescent units.
Figure 4
Figure 4. Expression and epigenetic analysis of midkine.
(A) Quantitative real time PCR analysis of midkine expression in control SRC cells (SRC Control), SRC cells that were treated for 5 passages with 5-Aza-2-deoxycytidine (SRC 5AZA), and SRC cells 5-with 5 passages Aza-2-deoxycytidine and then grown for 5 additional passages without treatment (5AZA-STOP). Treatment with 5-Aza-2-deoxycytidine induces midkine expression. Five passages following 5-Aza-2-deoxycytidine removal the expression of midkine has dropped but it is greater than that of untreated control cells. Bars represent the average expression of three biologic replicates, and error bars represent the standard deviation of these replicates. ‘*’ Indicates values that are significantly different than the “SRC Control” sample (p<.05). Note that for graphical representation two different vertical scale bars are shown; the vertical scale bar on the left corresponds to the SRC Control and SRC 5AZA-STOP samples, and the vertical Scale bar on the right corresponds with the SRC 5AZA-STOP sample. (B) Schematic representation of analyzed CpG islands in relation to the midkine transcriptional start site (TSS). Green bars indicate regions that were targeted for bisulfite sequencing. Bisulfite sequencing of midkine CpG Island 1 and CpG Island 2. Each row indicates an individual cloned sequence. Circles represent CpG sites. Black circles indicate a methylated CpG site and white circles indicate a unmethylated CpG site. These changes in methylation of the midkine promoter were confirmed by pyrosequencing (Figure S3A). These results demonstrate that 5-Aza-2-deoxycytidine treatment leads to the hypomethylation of CpG islands that span regions of the rat midkine gene.
Figure 5
Figure 5. Expression and epigenetic analysis of sox-2.
(A) Quantitative real time PCR analysis of sox-2 expression in control SRC cells (SRC Control), SRC cells that were treated for 5 passages with 5-Aza-2-deoxycytidine (SRC 5AZA), and SRC cells 5-with 5 passages Aza-2-deoxycytidine and then grown for 5 additional passages without treatment (5AZA-STOP). Treatment with 5-Aza-2-deoxycytidine induces sox-2 expression. Five passages following 5-Aza-2-deoxycytidine removal the expression of sox-2 has dropped. Bars represent the average expression of three biologic replicates, and error bars represent the standard deviation of these replicates. ‘*’ Indicates values that are significantly different than the “SRC Control” sample (p<.05). (B) Schematic representation of analyzed CpG islands in relation to the sox-2 transcriptional start site (TSS). Green bars indicate regions that were targeted for bisulfite sequencing. Bisulfite sequencing of sox-2 CpG Island 47 and CpG Island 154. Each row indicates an individual cloned sequence. Circles represent CpG sites. Black circles indicate a methylated CpG site and white circles indicate an unmethylated CpG site. CpG 47 Island was methylated in untreated SRC cells but following 5-Aza-2-deoxycytidine treatment it became hypomethylated. These changes in methylation of the sox-2 promter were confirmed by pyrosequencing (Figure S3B). CpG Island 154 was not methylated in either control or treated cells (Figure S4).
Figure 6
Figure 6. 5-Aza-2-deoxycytidine treated SRC cells produced larger tumors than untreated SRC cells.
(A) In vivo bioluminescent imaging of SRC cells in nude mice. 5×10⁶ Control cells [animal a; left] and 5×10⁶ 5-Aza-2-deoxycytidine treated cells [animal B; right] were injected subcutaneously. This image was collected 6 weeks after tumor induction. This Image corresponds to animal 3a and 3b in Table S5. (B) Summary of in vivo SRC injections. Tumors induced with 5-Aza-2-deoxycytidine-treated SRC cells produced larger tumors than the tumors induced with SRC control cells. A linear regression method was applied to analyze tumor weight between two tumor groups (SRC Control and SRC 5AZA) after adjusting for the number of cells injected. For graphical representation the tumor weights and the number of cells injected was log transformed. p-value is for comparison of the two tumor groups (SRC Control and SRC 5AZA), and indicates that there is a significant difference in tumor weight between the two groups. Results are shown for 7 animals with tumors induced from untreated cells (SRC control) and for 7 animals with tumors induced from 5-Aza-2-deoxycytidine-treated cells (SRC 5AZA). Detailed in vivo tumor summary is presented in Table S5.
Figure 7
Figure 7. Photomicroscopy of histological sections obtained from SRC tumors (20x magnification).
(A) Subcutaneous tumor induced from untreated SRC control cells. (B) Subcutaneous tumor induced from 5-Aza-2-deoxycytidine SRC cells. Approximately 60 days following tumor induction animals were sacrificed and tumors were removed for histology. Tumors from the SRC control cells and the 5-Aza-2-deoxycytidine cells showed considerable heterogeneity. There was no clear histological difference between tumors initiated from control cells or treated cells. Low grade (Grade 1) – Small nuclei with low variation in size and abundant cartilage matrix. Intermediate grade (Grade 2) – Higher cellularity, larger nuclei with increased atypia and hyperchromasia. High grade (Grade 3) – Pleomorphic cells with greater degree atypia and nuclear size. The SRC cells are stained with Safranin O (red).
Figure 8
Figure 8. Pyrosequencing of LINE and Satellite 1 and 2 in vivo.
Pyrosequencing results are also displayed from tumor samples: tumors initiated from untreated SRC cells (SRC Control) and tumors initiated from SRC cells that were treated for 5 passages with 5-Aza-2-deoxycytidine (SRC 5AZA). Results are shown for 3 SRC Control tumors and 3 SRC 5AZA tumors. Pyrosequencing assay: LINE1-S1; [2481 CpG's], LINE1-S2; [3308 CpG's], Satellite I [15CpG's], Satellite II [411 CpG's]. In all regions examined by pyrosequencing the SRC 5AZA tumors have a significantly lower level of methylation than the SRC Control tumors. Bars represent the average DNA methylation % of three biologic replicates, and error bars represent the standard deviation of these replicates. ‘*’ Indicates values that are significantly different than the “SRC Control” sample (p<.05).

Similar articles

Cited by

References

    1. Brena RM, Costello JF. Genome-epigenome interactions in cancer. Hum Mol Genet 16 Spec No. 2007;1:R96–105. - PubMed
    1. Mund C, Brueckner B, Lyko F. Reactivation of epigenetically silenced genes by DNA methyltransferase inhibitors: basic concepts and clinical applications. Epigenetics. 2006;1:7–13. - PubMed
    1. Chen L, MacMillan AM, Chang W, Ezaz-Nikpay K, Lane WS, et al. Direct identification of the active-site nucleophile in a DNA (cytosine-5)-methyltransferase. Biochemistry. 1991;30:11018–11025. - PubMed
    1. Santi DV, Norment A, Garrett CE. Covalent bond formation between a DNA-cytosine methyltransferase and DNA containing 5-azacytosine. Proc Natl Acad Sci U S A. 1984;81:6993–6997. - PMC - PubMed
    1. Mund C, Hackanson B, Stresemann C, Lubbert M, Lyko F. Characterization of DNA demethylation effects induced by 5-Aza-2′-deoxycytidine in patients with myelodysplastic syndrome. Cancer Res. 2005;65:7086–7090. - PubMed

Publication types

MeSH terms