. 2009 Dec 18;4(12):e8274.
doi: 10.1371/journal.pone.0008274.

An epigenetic signature in peripheral blood predicts active ovarian cancer

Affiliations

An epigenetic signature in peripheral blood predicts active ovarian cancer

Andrew E Teschendorff et al. PLoS One. .

Abstract

Background: Recent studies have shown that DNA methylation (DNAm) markers in peripheral blood may hold promise as diagnostic or early detection/risk markers for epithelial cancers. However, to date no study has evaluated the diagnostic and predictive potential of such markers in a large case control cohort and on a genome-wide basis.

Principal findings: By performing genome-wide DNAm profiling of a large ovarian cancer case control cohort, we here demonstrate that active ovarian cancer has a significant impact on the DNAm pattern in peripheral blood. Specifically, by measuring the methylation levels of over 27,000 CpGs in blood cells from 148 healthy individuals and 113 age-matched pre-treatment ovarian cancer cases, we derive a DNAm signature that can predict the presence of active ovarian cancer in blind test sets with an AUC of 0.8 (95% CI (0.74-0.87)). We further validate our findings in another independent set of 122 post-treatment cases (AUC = 0.76 (0.72-0.81)). In addition, we provide evidence for a significant number of candidate risk or early detection markers for ovarian cancer. Furthermore, by comparing the pattern of methylation with gene expression data from major blood cell types, we here demonstrate that age and cancer elicit common changes in the composition of peripheral blood, with a myeloid skewing that increases with age and which is further aggravated in the presence of ovarian cancer. Finally, we show that most cancer and age associated methylation variability is found at CpGs located outside of CpG islands.

Significance: Our results underscore the potential of DNAm profiling in peripheral blood as a tool for detection or risk-prediction of epithelial cancers, and warrants further in-depth and higher CpG coverage studies to further elucidate this role.


Conflict of interest statement

Competing Interests: Ian J. Jacobs is a consultant in the field of ovarian cancer to Becton Dickinson.

Figures

Figure 1
Figure 1. Prediction of tumor presence by a DNAm signature in blood.
a–b) Classification performance of DNA methylation classifiers in a) training sets and b) blind test sets. Training and test sets consisted of blood samples from pre-treatment cases and healthy individuals (Materials and Methods). Average ROC curve over 100 different training/test set partitions with 95% CI envelope in blind test sets. Mean AUC and 95% CI over 100 different partitions are given. c) Classification performance in test sets consisting of healthy controls and post-treatment samples with evidence of active disease. d) Correlation between the ranking of top CpGs discriminating pre-treatment cases from healthy controls in regression models that included age (x-axis) and without age (y-axis) as a co-factor. Plotted are the log10(p-values) for the 25,642 CpG sites, as evaluated from multiple logistic regressions of case/control status against the CpG methylation profile with age as a co-factor (x-axis) and without age as a co-factor (y-axis). Spearman correlation between the two rankings is given.
Figure 2
Figure 2. Cancer and age CpGs, and GSEA.
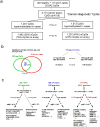
a) Distribution of 2,714 CA-CpGs (FDR<0.05) in terms of hyper-and-hypomethylation (Binomial test P-value given), as well in relation to CpG localisation (Fisher's exact test). b) Overlap of age-CpGs with CA-CpGs (Fisher-test P-value of overlap given) and distribution of the 198 common age and CA-CpGs in terms of hypermethylated and hypomethylated patterns and iCpGs/niCpGs (Binomial and Fisher-test P-values are given, respectively). Out of the 198 CpGs, 47 exbited hypermethylation with age and cancer, 150 hypomethylation with age and cancer, 1 hyperM with age and hypoM with cancer and 0 showed hypoM with age and hypeM in cancer. c) Gene Set Enrichment Analysis for the common age CA-CpGs, age-specific CpGs (i.e age CpGs minus CA-CpGs) and CA-specific CpGs (i.e CA-CpGs minus age-CpGs) stratified according to hyper/hypometylation. Benjamini-Hochberg adjusted P-values are given. Most significantly enriched biological terms are given.
Figure 3
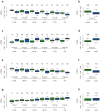
Figure 3. Age-dependent methylation patterns are associated with ovarian cancer.
Average methylation patterns of age-associated CpGs selected through supervised analysis. (a–b) age hypomethylated niCpGs. (c–d) age hypermethylated niCpGs. (e–f) age hypomethylated iCpGs. (g–h) age hypermethylated iCpGs. (a,c,e,g) Average methylation (y-axis) of controls (green) and cases (blue) for each of the six age groups (x-axis) (50–55,55–60,60–65,65–70,70–75,>75). (b,d,f,h) Average methylation versus disease status (all age groups combined). All P-values are from a two-tailed Wilcoxon rank sum test. In all panels, we give the numbers of samples in each group above the corresponding boxplot. Cases are pre-treatment samples.
Figure 4
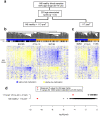
Figure 4. Clustering of samples over age-associated CpGs.
a) Multivariate linear regression of age in 148 healthy blood samples against CpG methylation profiles adjusting for BSC efficiency, batch and DNA input effects, identified 293 CpGs at q(FDR)<0.3. b) Hierarchical clustering of the 148 healthy controls and 113 pre-treatment (preT) cases over the 293 CpGs. The two main clusters (CLUST) predicted by the algorithm are labelled as blue and orange. Case control status is indicated as active disease (AD): case = black, control = grey. c) Hierarchical clustering of 117 post-treatment cases over same 293 CpGs. Of the 117 post-treatment cases, 47 and 70 had recurrent (black) and no recurrent (grey) active disease (AD) at sample draw, respectively. The two main clusters (CLUST) predicted by the algorithm are labelled as blue and orange. In the heatmaps, CpG specific methylation β-values were standardised to zero mean and unit variance for sake of clarity (blue: high relative methylation, yellow = low relative methylation). In panels b) and c) we give the number of samples with active disease at sample draw in each cluster, and give the corresponding Fisher's exact test P-value. d) Comparison of observed P-values with those obtained by 1000 random selections of 293 CpGs. P-values were computed from Fisher's exact test for the two clusters inferred from applying a Gaussian mixture model .

References

    1. Feinberg AP, Ohlsson R, Henikoff S. The epigenetic progenitor origin of human cancer. Nat Rev Genet. 2006;7:21–33. - PubMed
    1. Baylin SB, Ohm JE. Epigenetic gene silencing in cancer - a mechanism for early oncogenic pathway addiction? Nat Rev Cancer. 2006;6:107–116. - PubMed
    1. Christensen BC, Houseman EA, Godleski JJ, Marsit CJ, Longacker JL, et al. Epigenetic profiles distinguish pleural mesothelioma from normal pleura and predict lung asbestos burden and clinical outcome. Cancer Res. 2009;69:227–234. - PMC - PubMed
    1. Cooney CA. Epigenetics–dna-based mirror of our environment? Dis Markers. 2007;23:121–137. - PMC - PubMed
    1. Widschwendter M, Fiegl H, Egle D, Mueller-Holzner E, Spizzo G, et al. Epigenetic stem cell signature in cancer. Nat Genet. 2007;39:157–158. - PubMed

Publication types