

An information gap in DNA evidence interpretation
- PMID: 20020039
- PMCID: PMC2791197
- DOI: 10.1371/journal.pone.0008327
An information gap in DNA evidence interpretation
Abstract
Forensic DNA evidence often contains mixtures of multiple contributors, or is present in low template amounts. The resulting data signals may appear to be relatively uninformative when interpreted using qualitative inclusion-based methods. However, these same data can yield greater identification information when interpreted by computer using quantitative data-modeling methods. This study applies both qualitative and quantitative interpretation methods to a well-characterized DNA mixture and dilution data set, and compares the inferred match information. The results show that qualitative interpretation loses identification power at low culprit DNA quantities (below 100 pg), but that quantitative methods produce useful information down into the 10 pg range. Thus there is a ten-fold information gap that separates the qualitative and quantitative DNA mixture interpretation approaches. With low quantities of culprit DNA (10 pg to 100 pg), computer-based quantitative interpretation provides greater match sensitivity.
Conflict of interest statement
Figures
 and
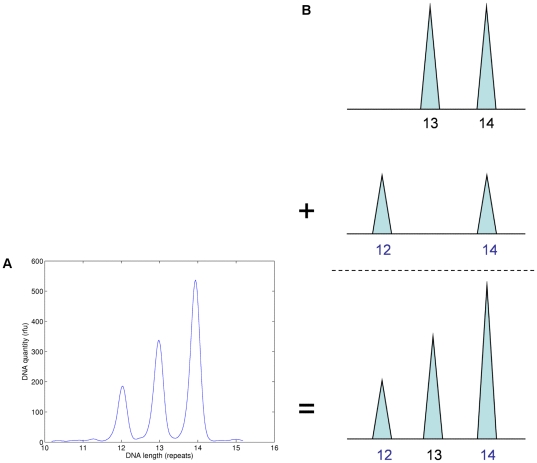
and  in respective 70% and 30% proportions forms a model of the observed allele peak height pattern.
 with three different unknown contributor allele pair candidates are shown at STR locus Penta D. The victim contribution is known to be 70%, and the culprit's is 30%. The allelic peak height pattern that best fits the observed data (Figure 1a) corresponds to the
  candidate (rightmost column). The other two candidates produce patterns that have a very poor fit to the quantitative data peaks. Therefore, based on a multivariate normal likelihood function, allele pair candidate
  would have the greatest probability of arising from the culprit genotype.


Similar articles
-
TrueAllele casework on Virginia DNA mixture evidence: computer and manual interpretation in 72 reported criminal cases.PLoS One. 2014 Mar 25;9(3):e92837. doi: 10.1371/journal.pone.0092837. eCollection 2014. PLoS One. 2014. PMID: 24667531 Free PMC article.
-
NIST interlaboratory studies involving DNA mixtures (MIX13): A modern analysis.Forensic Sci Int Genet. 2018 Nov;37:172-179. doi: 10.1016/j.fsigen.2018.08.014. Epub 2018 Aug 27. Forensic Sci Int Genet. 2018. PMID: 30176439
-
TrueAllele(®) Genotype Identification on DNA Mixtures Containing up to Five Unknown Contributors.J Forensic Sci. 2015 Jul;60(4):857-68. doi: 10.1111/1556-4029.12788. Epub 2015 Jul 17. J Forensic Sci. 2015. PMID: 26189920
-
The advances in DNA mixture interpretation.Forensic Sci Int. 2019 Aug;301:101-106. doi: 10.1016/j.forsciint.2019.05.024. Epub 2019 May 20. Forensic Sci Int. 2019. PMID: 31153987 Review.
-
[Low template DNA profiling and its application in forensic science].Fa Yi Xue Za Zhi. 2010 Apr;26(2):132-6. Fa Yi Xue Za Zhi. 2010. PMID: 20653141 Review. Chinese.
Cited by
-
Validating TrueAllele® Interpretation of DNA Mixtures Containing up to Ten Unknown Contributors.J Forensic Sci. 2020 Mar;65(2):380-398. doi: 10.1111/1556-4029.14204. Epub 2019 Oct 3. J Forensic Sci. 2020. PMID: 31580496 Free PMC article.
-
Open practices in our science and our courtrooms.Trends Genet. 2022 Feb;38(2):113-115. doi: 10.1016/j.tig.2021.09.010. Epub 2021 Nov 2. Trends Genet. 2022. PMID: 34740452 Free PMC article.
-
New York State TrueAllele ® casework validation study.J Forensic Sci. 2013 Nov;58(6):1458-66. doi: 10.1111/1556-4029.12223. Epub 2013 Jul 18. J Forensic Sci. 2013. PMID: 23865896 Free PMC article.
-
Four model variants within a continuous forensic DNA mixture interpretation framework: Effects on evidential inference and reporting.PLoS One. 2018 Nov 20;13(11):e0207599. doi: 10.1371/journal.pone.0207599. eCollection 2018. PLoS One. 2018. PMID: 30458020 Free PMC article.
-
Forensic trace DNA: a review.Investig Genet. 2010 Dec 1;1(1):14. doi: 10.1186/2041-2223-1-14. Investig Genet. 2010. PMID: 21122102 Free PMC article.
References
-
- National Research Council. Evaluation of Forensic DNA Evidence: Update on Evaluating DNA Evidence. Washington, DC: National Academies Press; 1996.
-
- Butler JM. Forensic DNA Typing: Biology, Technology, and Genetics of STR Markers. New York: Academic Press; 2005.
-
- Zedlewski E, Murphy MB. DNA analysis for “minor” crimes: a major benefit for law enforcement. NIJ Journal. 2006;253:2–5.
-
- Gill P, Whitaker J, Flaxman C, Brown N, Buckleton J. An investigation of the rigor of interpretation rules for STRs derived from less than 100 pg of DNA. Forensic Sci Intl. 2000;112:17–40. - PubMed
-
- Michaelis RC, Flanders RG, Wulff P. A Litigator's Guide to DNA: From the Laboratory to the Courtroom. New York: Academic Press; 2008.
Publication types
MeSH terms
LinkOut - more resources
Full Text Sources
Miscellaneous
