. 2010 Mar;222(3):738-47.
doi: 10.1002/jcp.22005.

Kinetic properties of ASC protein aggregation in epithelial cells

Affiliations

Kinetic properties of ASC protein aggregation in epithelial cells

Jun Cheng et al. J Cell Physiol. 2010 Mar.

Abstract

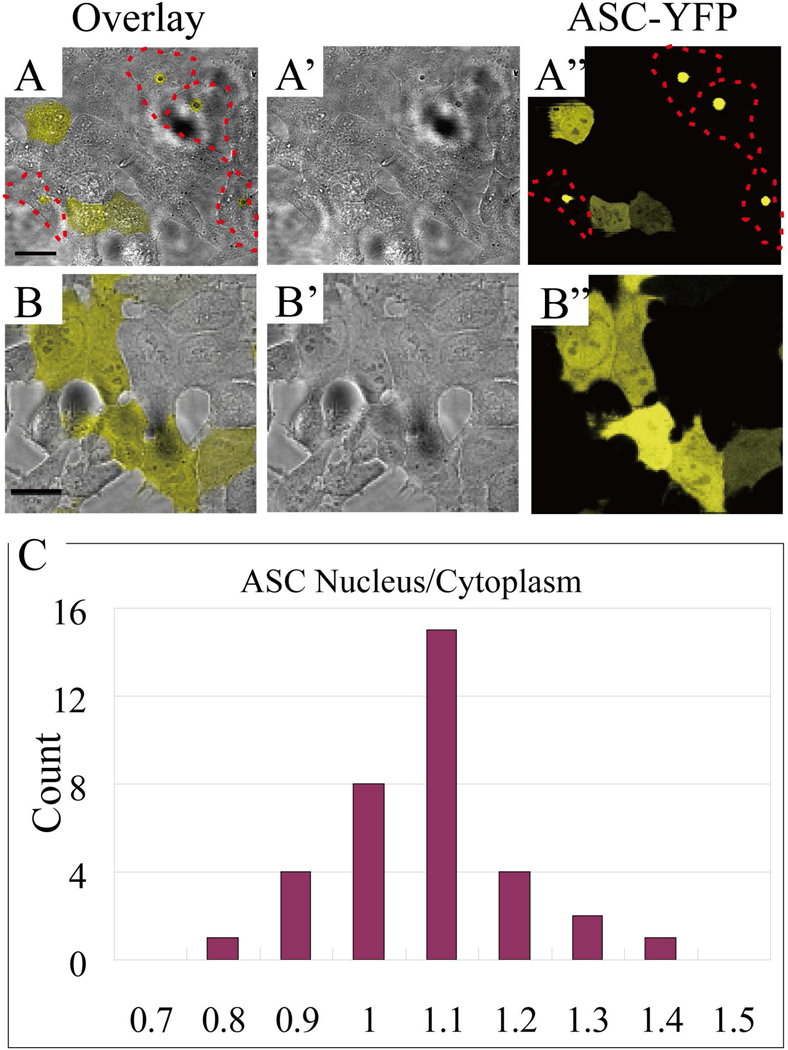
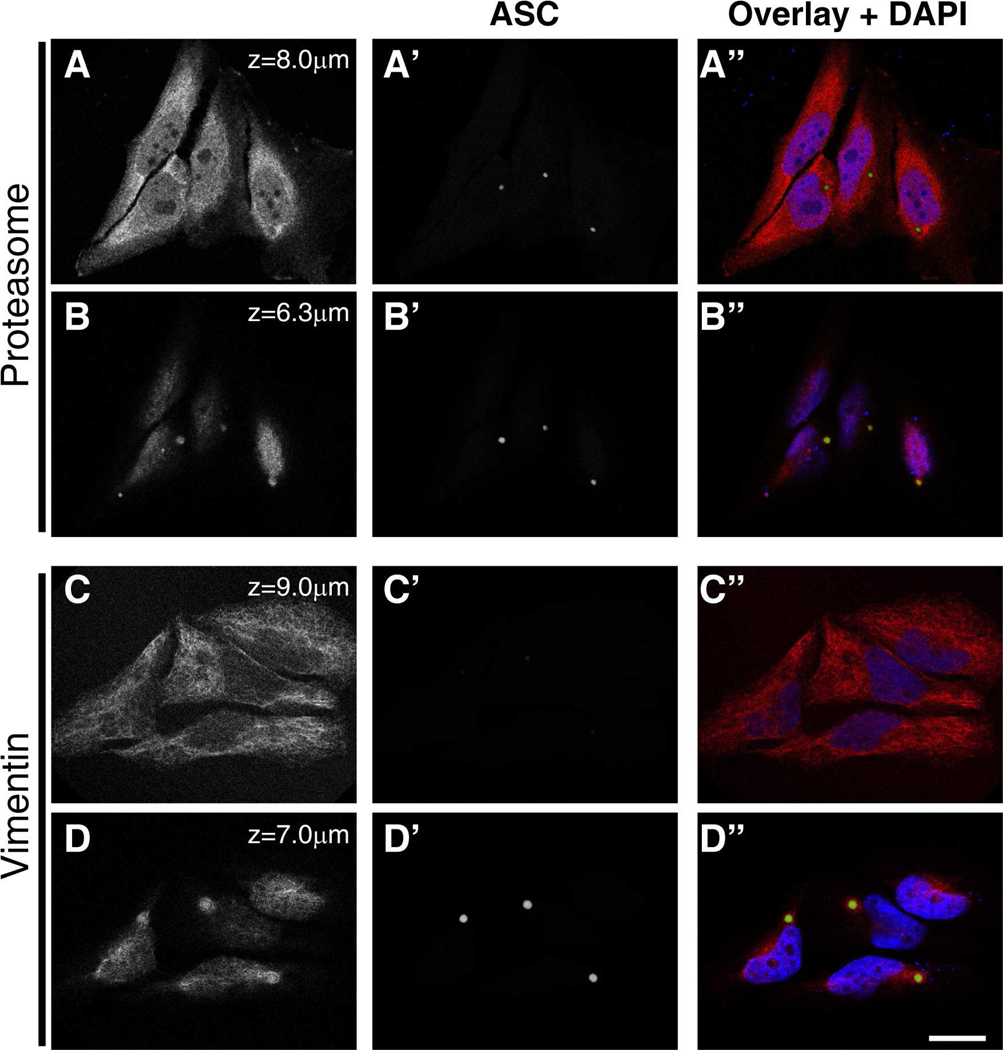
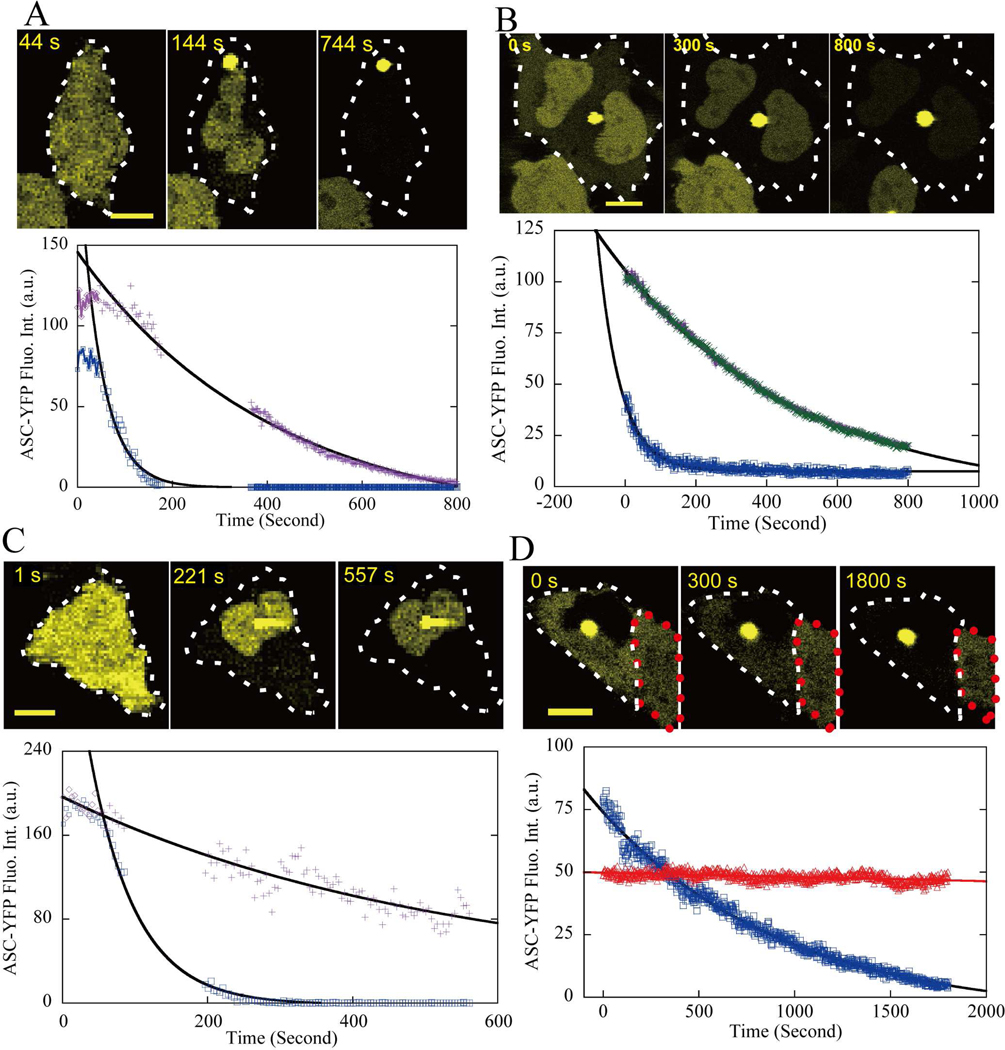
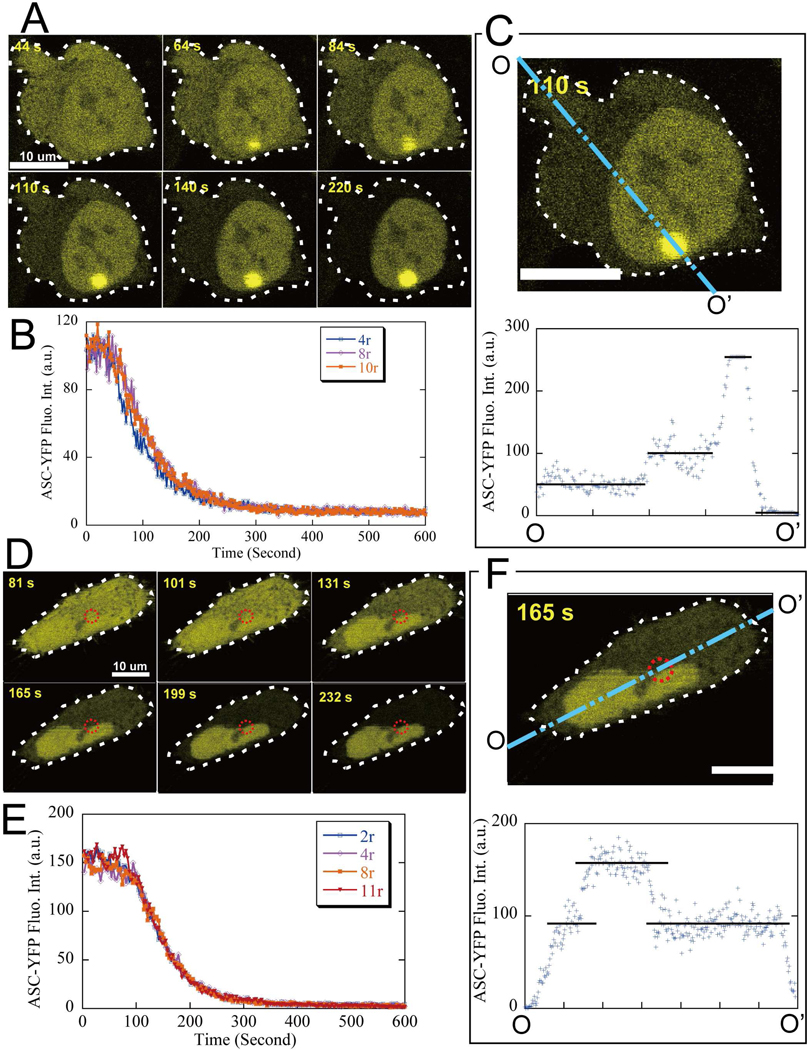
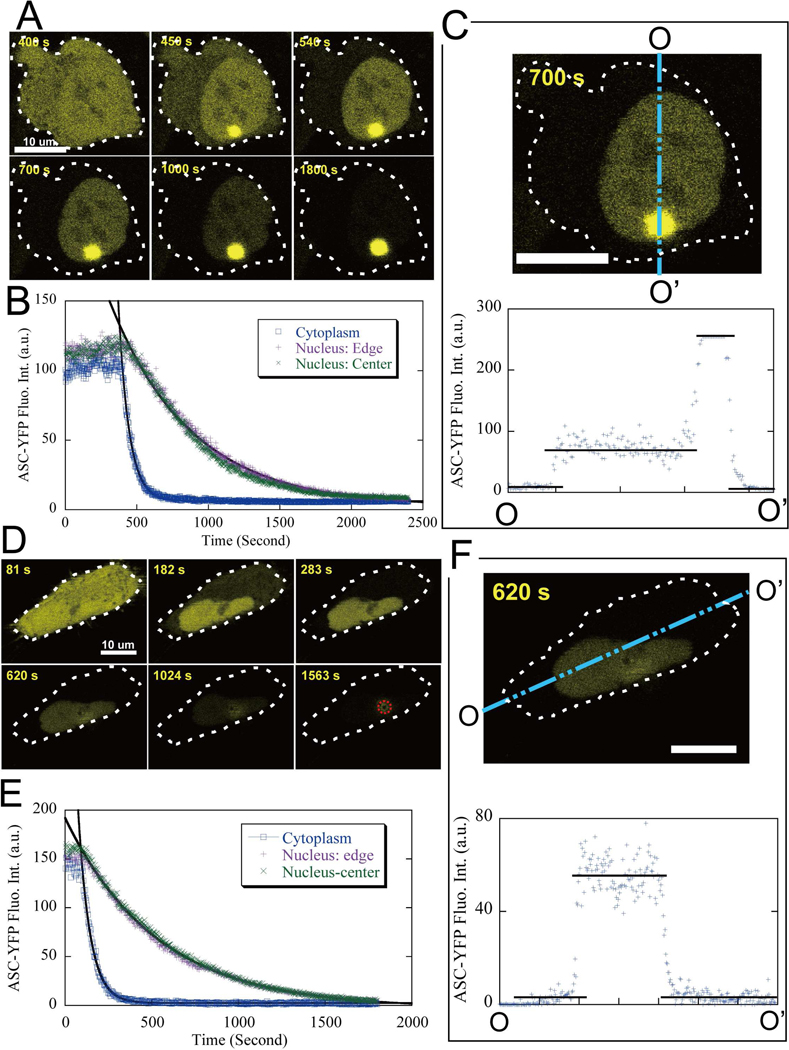
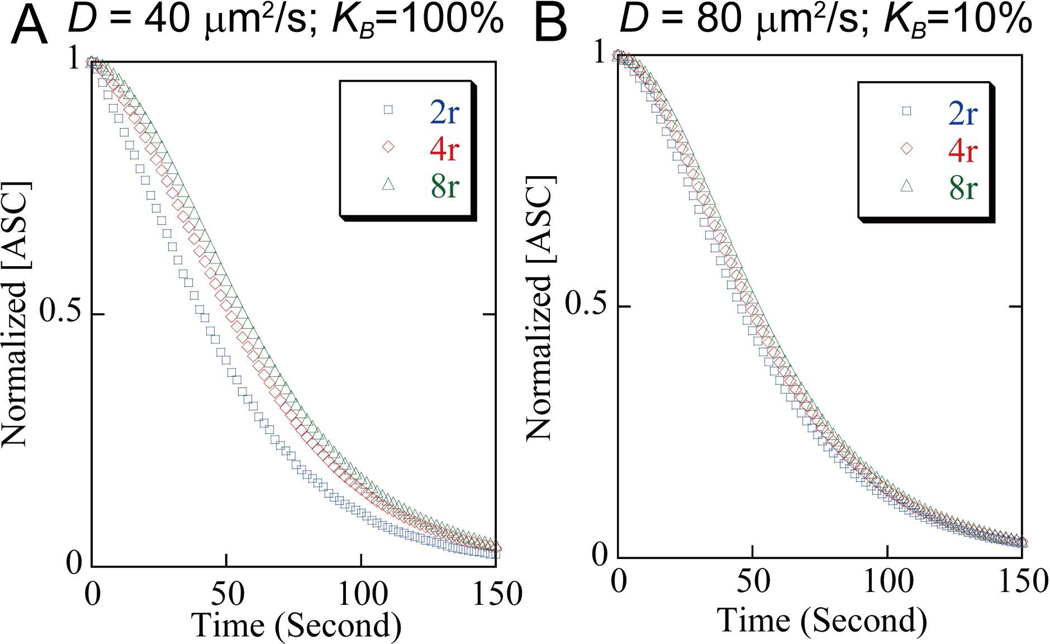
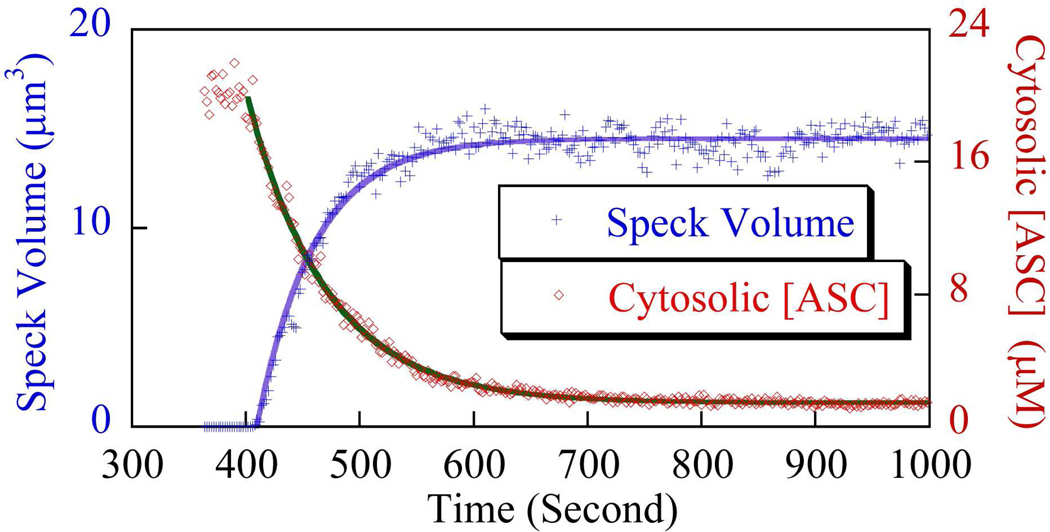
Apoptosis-associated speck-like protein with CARD domain (ASC), an adaptor protein composed of caspase recruitment and pyrin domains, can efficiently self-associate to form a large spherical structure, called a speck. Although ASC aggregation is generally involved with both inflammatory processes and apoptosis, the detailed dynamics of speck formation have not been characterized. In this report, speck formation in HeLa cells transfected with ASC is examined by time-lapse live-imaging by confocal laser scanning microscopy. The results show that ASC aggregation is a very rapid and tightly regulated process. Prior to speck formation, soluble ASC aggregation is a low probability event, and the affinity of ASC subunits for one another is very low. Following a speck nucleation event, the affinity for further addition of ASC subunits increases dramatically, and aggregation is a highly energetically favorable reaction (Gibbs free energy approximately -40 kJ/mol). This leads to a rapid depletion of soluble ASC, making it highly unlikely that a second speck will form inside the same cell and assuring that speck formation is "all or none," with a well-defined end point. Comparison with kinetic models of the aggregation process indicates diffusion, instead of active transport, is the dominant process for speck growth. Though speck formation and aggresome formation share some properties, we show that the two processes are distinct.


Figures

Figure 1.
Figure 1.. ASC distribution throughout cytoplasm and nucleus.
(A and B). Confocal images of ASC-YFP transfected HeLa cells, where A and B are overlays of bright field image (A’, B’) and ASC-YFP fluorescence images (A”, B”). Cells in which specks have formed are outlined by a red dashed line. Scale bar: 20 μm. (C). Histogram of the ratio of ASC-YFP fluorescence intensity in the cytoplasm to that inside nucleus prior to speck formation. A total of 35 transfected HeLa cells were analyzed.
Figure 2:
Figure 2:. Specks share some, but not all characteristics of aggresomes.
(A and B). HeLa cells were transfected with ASC-YFP and incubated for 24 hours to allow speck formation (green). The proteasome was visualized using an antibody to the alpha subunit (red). Only cells that have assembled proteasomes exhibit specks and specks co-localize with the forming proteasome. Panels A, A’, and A” show proteasome staining, ASC staining and merged images, respectively, for a confocal slice near the bottom of the cell. Panels B, B’ and B” represent the same cell, but images are obtained from a slice near the top of the cell, where the proteasome is forming. (C and D). Transfected HeLa cells were stained with anti-vimentin (red) to visualize intermediate filaments. Though intermediate filaments are known to collapse around aggresomes, speck formation does not seem to alter the distribution of intermediate filaments. Panels C, C’ and C” represent staining for vimentin, ASC and merged images, respectively, from a confocal slice near the bottom of the cell, showing an intact vimentin network. Panels D, D’ and D” represent the same staining in a region near the top of the cell where the speck resides. Though some co-localization of vimentin and ASC is visible, the vimentin network is not collapsed around the speck. Scale bar: 20 μm.
Figure 3:
Figure 3:. Examples of the speck formation process.
“□” blue data points for cytoplasm and “+” purple (and “x” green) for nucleus. The solid curves are single exponential fits. All scale bars are 10 μm. (A). Typical perinuclear speck formation. The ASC fluorescence depletion time constant was τ = 46.4±0.8 seconds for the cytoplasm and τ = 409 ± 10 seconds for the nucleus. (B). Speck formation inside a HeLa cell with two nuclei, where “+” (“x”) indicates the upper-left (lower-right) nucleus respectively. The ASC fluorescence intensity in the nucleus and cytoplasm was independently monitored and plotted: τ = 64 ± 2 seconds for the cytoplasm and τ = 529 ± 6 seconds for the nucleus. (C). Speck formation overlapping the nucleus. The cytoplasmic location of the speck was indicated by the different time constants in cytoplasm (τ = 64 ± 2 seconds) and the nucleus (τ = 851 ± 487 seconds). (D). Speck formation inside the nucleus. ASC fluorescence intensity depleted initially inside the nucleus, and was followed by a much slower depletion in the cytoplasm (τ = 950 ± 16 seconds). The red dotted line indicates a non-speck-forming cell serving as a control next to the speck-forming cell, and “ Δ” red data points are the ASC fluorescence intensity for the control cell.
Figure 4.
Figure 4.. ASC depletion rate is the same at all locations within the cytoplasm.
The cytoplasmic locations are labeled by their distance from the speck center and scaled by the corresponding mature speck radius (r). All scale bars are 10 μm. (A-C). Cytoplasmic ASC depletion with the speck visible on the same focal plane. A. time-lapse image sequences. B. ASC fluorescence intensity at different cytoplasmic locations as a function of time ( τ = 73.6 ± 0.4 seconds). C. A cross-section profile of ASC fluorescence intensity. (D-F). Cytoplasmic ASC depletion with the speck on a different focal plane. D. Time-lapse image sequences, where the dashed circle indicates the speck location at a different focal plane. E. ASC fluorescence intensity at different cytoplamic locations as a function of time (τ = 67.6 ± 0.4 seconds). F. A cross-section profile of ASC fluorescence intensity.
Figure 5.
Figure 5.. Slower nuclear ASC depletion.
Blue “□” data points are for cytoplasm, purple “+” for the nuclear edge and green “x” for nuclear center locations inside the nucleus, respectively. All scale bars are 10 μm. (A-C). Nuclear ASC depletion with the cytoplasmic speck on the same focal plane. A. Time-lapse image sequences. B. ASC fluorescence intensity at different nuclear locations and inside cytoplasm as a function of time (τ = 568 ± 4 seconds for nuclear locations). C. A cross-section profile of ASC fluorescence intensity. (D-F). The nuclear ASC depletion process with the speck on a different focal plane. D. Time-lapse image sequences, where the dashed circle indicates the speck location on a different focal plane. E. ASC fluorescence intensity at different nuclear locations and in the cytoplasm as a function of time (τ = 526 ± 2 seconds for nuclear locations). F. A cross-section profile of ASC fluorescence intensity.
Figure 6.
Figure 6.. Simulation of ASC aggregation during speck formation based on a free diffusion model.
(A). D = 40 mm2/s and KB=100%. (B). D = 80 mm2/s and KB=10%. All other simulation parameters are taken from experimental measurements: 1.5 μm for mature speck radius (r) and 20 μm for cell radius. “□” – 2r distance from speck center, “◇” – 4r, and “Δ” – 8r.
Figure 7.
Figure 7.. ASC aggregation analysis during speck formation.
The decreasing ASC concentration inside cytoplasm (“◇”) and the corresponding increasing speck volume (“+”), where the solid lines are single exponential curve fits. Data corresponds to Fig. 5B.

References

    1. Akahira J, Sugihashi Y, Ito K, Niikura H, Okamura K, Yaegashi N. 2004. Promoter methylation status and expression of TMS1 gene in human epithelial ovarian cancer. Cancer Sci 95(1):40–43. - PMC - PubMed
    1. Alumkal JJ, Zhang Z, Humphreys EB, Bennett C, Mangold LA, Carducci MA, Partin AW, Garrett-Mayer E, Demarzo AM, Herman JG. 2008. Effect of DNA Methylation on Identification of Aggressive Prostate Cancer. Urology. - PMC - PubMed
    1. Balci-Peynircioglu B, Waite AL, Schaner P, Taskiran ZE, Richards N, Orhan D, Gucer S, Ozen S, Gumucio D, Yilmaz E. 2008. Expression of ASC in Renal Tissues of Familial Mediterranean Fever Patients with Amyloidosis: Postulating a Role for ASC in AA Type Amyloid Deposition. Exp Biol Med (Maywood) 233(11):1324–1333. - PubMed
    1. Booth DR, Sunde M, Bellotti V, Robinson CV, Hutchinson WL, Fraser PE, Hawkins PN, Dobson CM, Radford SE, Blake CC, Pepys MB. 1997. Instability, unfolding and aggregation of human lysozyme variants underlying amyloid fibrillogenesis. Nature 385(6619):787–793. - PubMed
    1. Carrell RW, Gooptu B. 1998. Conformational changes and disease--serpins, prions and Alzheimer’s. Curr Opin Struct Biol 8(6):799–809. - PubMed

Publication types

Substances