

Visual inspection versus quantitative flow cytometry to detect aberrant CD2 expression in malignant T cells
- PMID: 20020522
- PMCID: PMC2916169
- DOI: 10.1002/cyto.b.20507
Visual inspection versus quantitative flow cytometry to detect aberrant CD2 expression in malignant T cells
Abstract
Background: Abnormal levels of T-cell antigen expression occur in T-cell neoplasia. We examined CD2 expression in malignant and normal T cells to determine if the level of CD2 expression differed significantly and if quantitation assisted in detecting this difference.
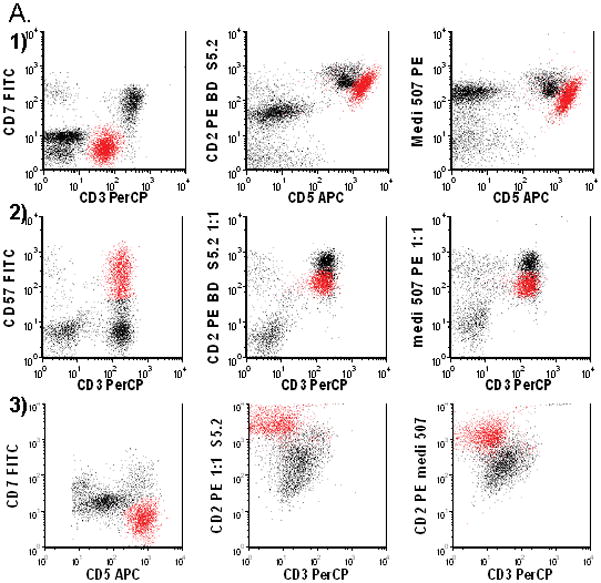
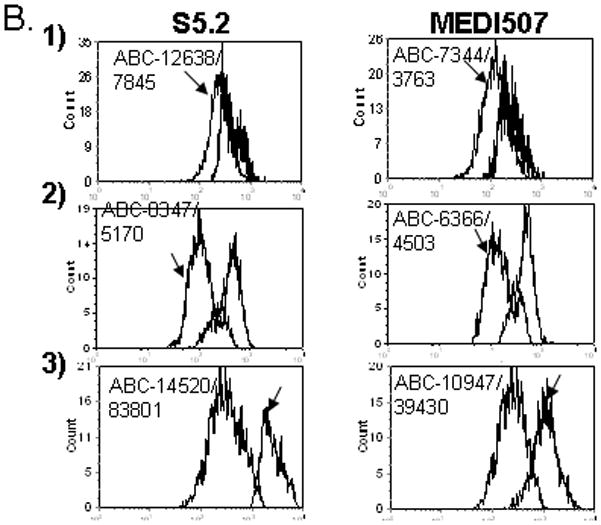
Method: Flow cytometric immunophenotypic (FCI) evaluation was performed on specimens from 36 patients with mature T-cell neoplasia. Abnormal T cells were identified based upon the abnormal FCI and morphology. Levels of CD2 expression were quantitated using 1:1 PE conjugates of anti-CD2 and QuantiBRITE bead standards to calculate the antibodies bound per cell (ABC). The efficacy of ABC measurement versus simple examination of dots plots was compared.
Results: Abnormal levels of CD2 expression were frequently observed in mature T-cell malignancies. The CD2 ABC values were highly sensitive in detecting differences between malignant and normal T cells (P = 0.0028). In most cases (24/32 specimens, 75%), CD2 ABCs differed by >20%. CD2 ABCs had high variability in normal T cells.
Conclusions: CD2 expression by malignant T cells differed significantly from that of normal T-cells by CD2 ABC quantitation. The high variability in normal T-cell CD2 ABCs limited the determination of normal reference ranges and, thus, its utility in the diagnosis of T-cell neoplasia. However, examination of CD2 can help in detection of tumor cells when residual normal T cells are present for comparison. Moreover, the increased sensitivity of CD2 quantitation is valuable in confirming FCI cases where abnormalities in CD2 expression are difficult to appreciate by visual inspection alone.
Published 2009 Wiley-Liss, Inc.
Figures
References
-
- Swerdlow SHCE, Harris NL, Jaffe ES, Pileri SA, Stein H, Thiele J, Vardiman JW. WHO Classification of Tumours of Haematopoietic and Lymphoid Tissues. IARC Press; Lyon, France: 2008.
-
- Jamal S, Picker LJ, Aquino DB, McKenna RW, Dawson DB, Kroft SH. Immunophenotypic analysis of peripheral T-cell neoplasms. A multiparameter flow cytometric approach. Am J Clin Pathol. 2001;116:512–526. - PubMed
-
- Juco J, Holden JT, Mann KP, Kelley LG, Li S. Immunophenotypic analysis of anaplastic large cell lymphoma by flow cytometry. American Journal of Clinical Pathology. 2003;119:205–212. - PubMed
-
- Gorczyca W, Weisberger J, Liu Z, et al. An approach to diagnosis of T-cell lymphoproliferative disorders by flow cytometry. Clinical Cytometry. 2002;50B:177–190. - PubMed
-
- Ahmad E, Garcia D, Davis BH. Clinical utility of CD23 and FMC7 antigen coexistent expression in B-cell lymphoproliferative disorder subclassification. Cytometry ( Clinical Cytomerty) 2002;50:1–7. - PubMed
Publication types
MeSH terms
Substances
Grants and funding
LinkOut - more resources
Full Text Sources
Other Literature Sources
Medical
