An in vitro assessment of acoustic radiation force impulse imaging for visualizing cardiac radiofrequency ablation lesions
- PMID: 20021518
- PMCID: PMC2883004
- DOI: 10.1111/j.1540-8167.2009.01664.x
An in vitro assessment of acoustic radiation force impulse imaging for visualizing cardiac radiofrequency ablation lesions
Abstract
Introduction: Lesion placement and transmurality are critical factors in the success of cardiac transcatheter radiofrequency ablation (RFA) treatments for supraventricular arrhythmias. This study investigated the capabilities of catheter transducer based acoustic radiation force impulse (ARFI) ultrasound imaging for quantifying ablation lesion dimensions.
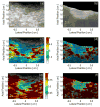
Methods and results: RFA lesions were created in vitro in porcine ventricular myocardium and imaged with an intracardiac ultrasound catheter transducer capable of acquiring spatially registered B-mode and ARFI images. The myocardium was sliced along the imaging plane and photographed. The maximum ARFI-induced displacement images of the lesion were normalized and spatially registered with the photograph by matching the surfaces of the tissue in the B-mode and photographic images. The lesion dimensions determined by a manual segmentation of the photographed lesion based on the visible discoloration of the tissue were compared to automatic segmentations of the ARFI image using 2 different calculated thresholds. ARFI imaging accurately localized and sized the lesions within the myocardium. Differences in the maximum lateral and axial dimensions were statistically below 2 mm and 1 mm, respectively, for the 2 thresholding methods, with mean percent overlap of 68.7 +/- 5.21% and 66.3 +/- 8.4% for the 2 thresholds used.
Conclusion: ARFI imaging is capable of visualizing myocardial RFA lesion dimensions to within 2 mm in vitro. Visualizing lesions during transcatheter cardiac ablation procedures could improve the success of the treatment by imaging lesion line discontinuity and potentially reducing the required number of ablation lesions and procedure time.
Figures


Similar articles
-
Contrast in intracardiac acoustic radiation force impulse images of radiofrequency ablation lesions.Ultrason Imaging. 2014 Apr;36(2):133-48. doi: 10.1177/0161734613519602. Ultrason Imaging. 2014. PMID: 24554293 Free PMC article.
-
In vitro photoacoustic visualization of myocardial ablation lesions.Heart Rhythm. 2014 Jan;11(1):150-7. doi: 10.1016/j.hrthm.2013.09.071. Epub 2013 Sep 27. Heart Rhythm. 2014. PMID: 24080065 Free PMC article.
-
Intracardiac acoustic radiation force impulse imaging: a novel imaging method for intraprocedural evaluation of radiofrequency ablation lesions.Heart Rhythm. 2012 Nov;9(11):1855-62. doi: 10.1016/j.hrthm.2012.07.003. Epub 2012 Jul 3. Heart Rhythm. 2012. PMID: 22772134 Free PMC article.
-
Feasibility of near real-time lesion assessment during radiofrequency catheter ablation in humans using acoustic radiation force impulse imaging.J Cardiovasc Electrophysiol. 2014 Dec;25(12):1275-83. doi: 10.1111/jce.12514. Epub 2014 Sep 10. J Cardiovasc Electrophysiol. 2014. PMID: 25132292 Free PMC article. Clinical Trial.
-
Challenges and implementation of radiation-force imaging with an intracardiac ultrasound transducer.IEEE Trans Ultrason Ferroelectr Freq Control. 2007 May;54(5):996-1009. doi: 10.1109/tuffc.2007.345. IEEE Trans Ultrason Ferroelectr Freq Control. 2007. PMID: 17523564 Free PMC article.
Cited by
-
Acoustic radiation force-based elasticity imaging methods.Interface Focus. 2011 Aug 6;1(4):553-64. doi: 10.1098/rsfs.2011.0023. Epub 2011 Jun 8. Interface Focus. 2011. PMID: 22419986 Free PMC article.
-
Transmural ultrasound imaging of thermal lesion and action potential changes in perfused canine cardiac wedge preparations by high intensity focused ultrasound ablation.PLoS One. 2013 Dec 12;8(12):e82689. doi: 10.1371/journal.pone.0082689. eCollection 2013. PLoS One. 2013. PMID: 24349337 Free PMC article.
-
Contrast in intracardiac acoustic radiation force impulse images of radiofrequency ablation lesions.Ultrason Imaging. 2014 Apr;36(2):133-48. doi: 10.1177/0161734613519602. Ultrason Imaging. 2014. PMID: 24554293 Free PMC article.
-
In vitro photoacoustic visualization of myocardial ablation lesions.Heart Rhythm. 2014 Jan;11(1):150-7. doi: 10.1016/j.hrthm.2013.09.071. Epub 2013 Sep 27. Heart Rhythm. 2014. PMID: 24080065 Free PMC article.
-
Intracardiac acoustic radiation force impulse imaging: a novel imaging method for intraprocedural evaluation of radiofrequency ablation lesions.Heart Rhythm. 2012 Nov;9(11):1855-62. doi: 10.1016/j.hrthm.2012.07.003. Epub 2012 Jul 3. Heart Rhythm. 2012. PMID: 22772134 Free PMC article.
References
-
- Bharat S, Techavipoo U, Kiss MZ, Liu W, Varghese T. Monitoring stiffness changes in lesions after radiofrequency ablation at different temperatures and durations of ablation. Ultrasound Med Biol. 2005 Mar;31(3):415–422. - PubMed
-
- Calkins H, Yong P, Miller JM, Olshansky B, Carlson M, Saul JP, Huang SK, Liem LB, Klein LS, Moser SA, Bloch DA, Gillette P, Prystowsky E. Catheter ablation of accessory pathways, atrioventricular nodal reentrant tachycardia, and the atrioventricular junction: final results of a prospective, multicenter clinical trial. the atakr multicenter investigators group. Circulation. 1999 Jan;99(2):262–270. - PubMed
-
- Cheema A, Dong J, Dalal D, Marine JE, Henrikson CA, Spragg D, Cheng A, Nazarian S, Bilchick K, Sinha S, Scherr D, Almasry I, Halperin H, Berger R, Calkins H. Incidence and time course of early recovery of pulmonary vein conduction after catheter ablation of atrial fibrillation. J Cardiovasc Electrophysiol. 2007;18:387–391. - PubMed
Publication types
MeSH terms
Grants and funding
LinkOut - more resources
Full Text Sources
Medical

