Comparative Study
. 2009 Dec 20:10:86.
doi: 10.1186/1471-2156-10-86.

Comparison of linkage disequilibrium and haplotype diversity on macro- and microchromosomes in chicken

Affiliations
Comparative Study

Comparison of linkage disequilibrium and haplotype diversity on macro- and microchromosomes in chicken

Hendrik-Jan Megens et al. BMC Genet. .

Abstract

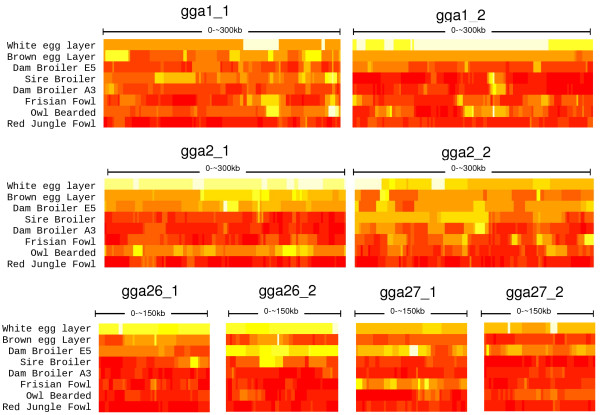
Background: The chicken (Gallus gallus), like most avian species, has a very distinct karyotype consisting of many micro- and a few macrochromosomes. While it is known that recombination frequencies are much higher for micro- as compared to macrochromosomes, there is limited information on differences in linkage disequilibrium (LD) and haplotype diversity between these two classes of chromosomes. In this study, LD and haplotype diversity were systematically characterized in 371 birds from eight chicken populations (commercial lines, fancy breeds, and red jungle fowl) across macro- and microchromosomes. To this end we sampled four regions of approximately 1 cM each on macrochromosomes (GGA1 and GGA2), and four 1.5 -2 cM regions on microchromosomes (GGA26 and GGA27) at a high density of 1 SNP every 2 kb (total of 889 SNPs).

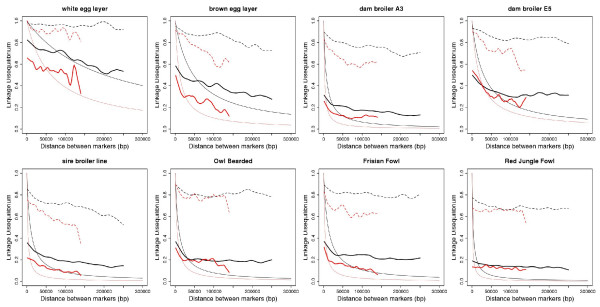
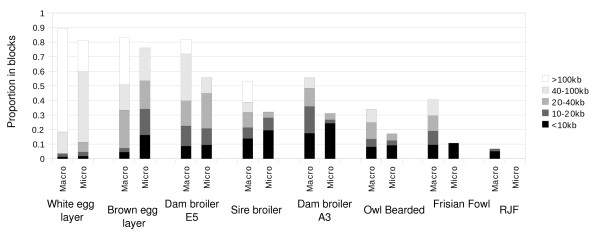
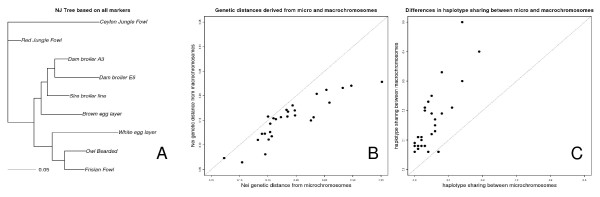
Results: At a similar physical distance, LD, haplotype homozygosity, haploblock structure, and haplotype sharing were all lower for the micro- as compared to the macrochromosomes. These differences were consistent across populations. Heterozygosity, genetic differentiation, and derived allele frequencies were also higher for the microchromosomes. Differences in LD, haplotype variation, and haplotype sharing between populations were largely in line with known demographic history of the commercial chicken. Despite very low levels of LD, as measured by r2 for most populations, some haploblock structure was observed, particularly in the macrochromosomes, but the haploblock sizes were typically less than 10 kb.

Conclusion: Differences in LD between micro- and macrochromosomes were almost completely explained by differences in recombination rate. Differences in haplotype diversity and haplotype sharing between micro- and macrochromosomes were explained by differences in recombination rate and genotype variation. Haploblock structure was consistent with demography of the chicken populations, and differences in recombination rates between micro- and macrochromosomes. The limited haploblock structure and LD suggests that future whole-genome marker assays will need 100+K SNPs to exploit haplotype information. Interpretation and transferability of genetic parameters will need to take into account the size of chromosomes in chicken, and, since most birds have microchromosomes, in other avian species as well.


Figures

Figure 1
Figure 1
Fitted and observed values of LD versus physical distance (bp), for the macrochromosomes (black) and microchromosomes (red). Observed values for r2 are in thick lines (lowess fit through averages over a sliding window), Fitted values using the Sved equation [21] are thin continuous lines, and observed values for D' are in hatched lines (lowess fit through averages over a sliding window).
Figure 2
Figure 2
Proportion of macro- and microchromosomes captured in haploblocks of different size. Block defenitions were according to Gabriel et al. [10]. For a similar analysis based on the 4 Gamete Rule see Additional File 4.
Figure 3
Figure 3
Haplotype Homozygosity (HH) for all the populations and for all the genomic regions, sampled with bins of 10 SNPs along a sliding window. High HH (1 haplotype present) is white, low HH is red. Lowest value of HH is 0.11, for Red Jungle Fowl. Intermediate values are shades of yellow and orange. Additional File 7 provides further insight in distribution of haplotypes.
Figure 4
Figure 4
A: Neighbor Joining tree based on genetic distances between population derived from all markers considered in this study. B:Difference between haplotype sharing based on microchromosomal (horizontal axis) versus sharing based on macrochromosomal (vertical axis) haplotypes. Sharing was calculated as the average over a sliding window of window size of ~30 kb. Haplotype sharing is almost consistently lower in microchromosomes. C: Difference in genetic distances based on microchromosomal (horizontal axis) and macrochromosomal (vertical axis) genotypes. Genetic distances are almost consistently higher in microchromosomes.

Similar articles

Cited by

References

    1. Andersson L, Georges M. Domestic-animal genomics: deciphering the genetics of complex traits. Nat Rev Genet. 2004;5:202–212. doi: 10.1038/nrg1294. - DOI - PubMed
    1. Aerts J, Megens HJ, Veenendaal T, Ovcharenko I, Crooijmans R, Gordon L, Stubbs L, Groenen M. Extent of linkage disequilibrium in chicken. Cytogenet Genome Res. 2007;117:338–45. doi: 10.1159/000103196. - DOI - PubMed
    1. Lindblad-Toh K, Wade CM, Mikkelsen TS, Karlsson EK, Jaffe DB, Kamal M, Clamp M, Chang JL, Kulbokas EJ, Zody MC, Mauceli E, Xie X, Breen M, Wayne RK. Genome sequence, comparative analysis and haplotype structure of the domestic dog. Nature. 2005;438:803–19. doi: 10.1038/nature04338. - DOI - PubMed
    1. Amaral AJ, Megens H, Crooijmans RPMA, Heuven HCM, Groenen MAM. Linkage Disequilibrium Decay and Haplotype Block Structure in the Pig. Genetics. 2008;179:569–579. doi: 10.1534/genetics.107.084277. - DOI - PMC - PubMed
    1. Andreescu C, Avendano S, Brown SR, Hassen A, Lamont SJ, Dekkers JCM. Linkage Disequilibrium in Related Breeding Lines of Chickens. Genetics. 2007;177:2161–9. doi: 10.1534/genetics.107.082206. - DOI - PMC - PubMed

Publication types