

ICOS expression by effector T cells influences the ability of regulatory T cells to inhibit anti-chromatin B cell responses in recipient mice
- PMID: 20022728
- PMCID: PMC2859982
- DOI: 10.1016/j.jaut.2009.11.016
ICOS expression by effector T cells influences the ability of regulatory T cells to inhibit anti-chromatin B cell responses in recipient mice
Abstract
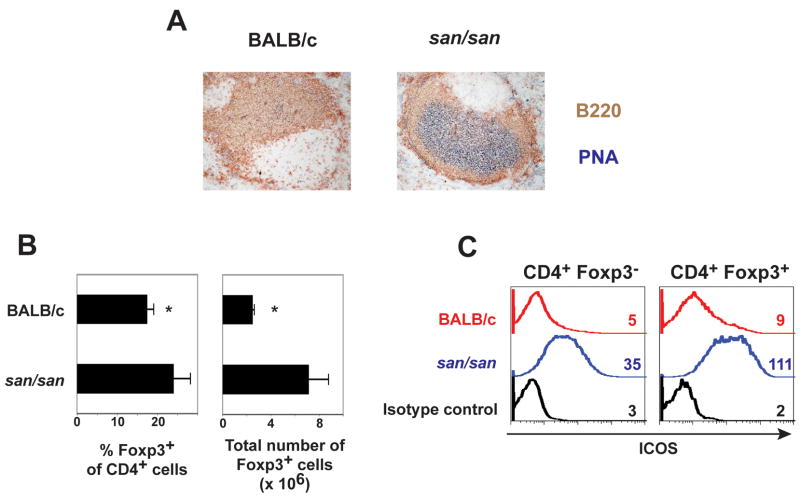
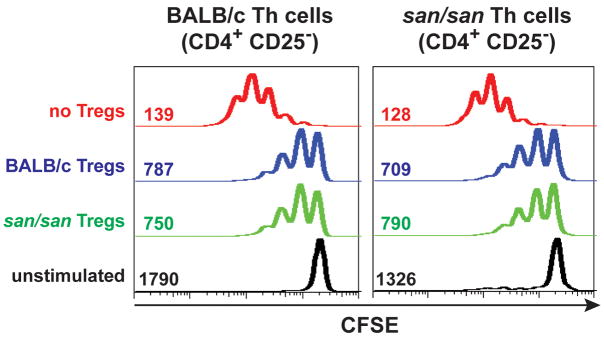
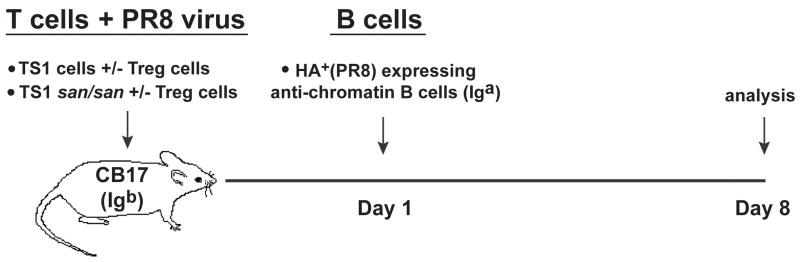
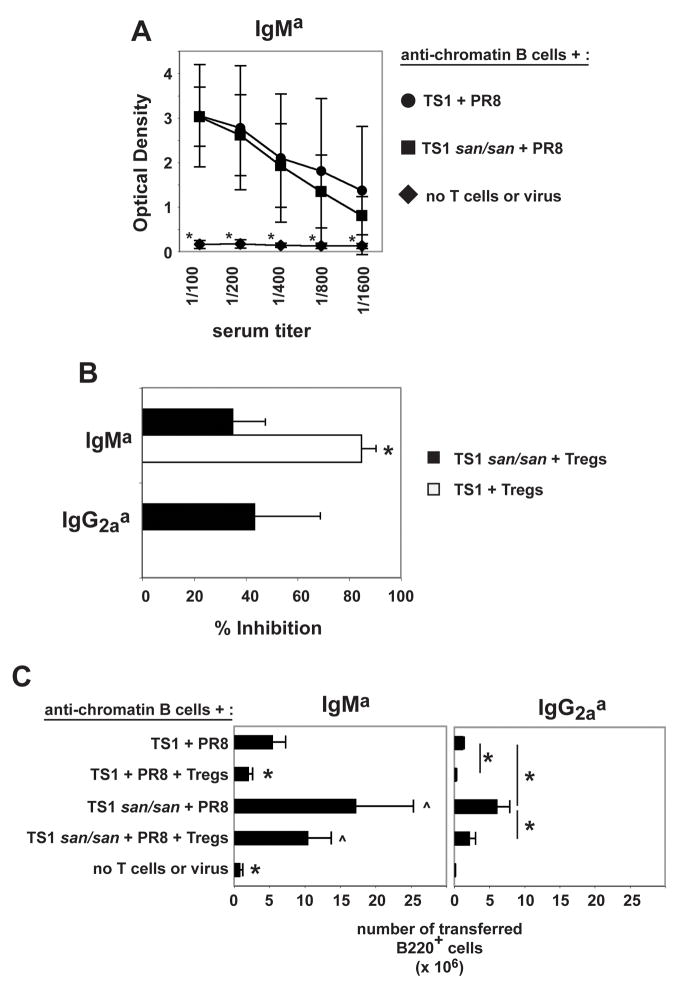
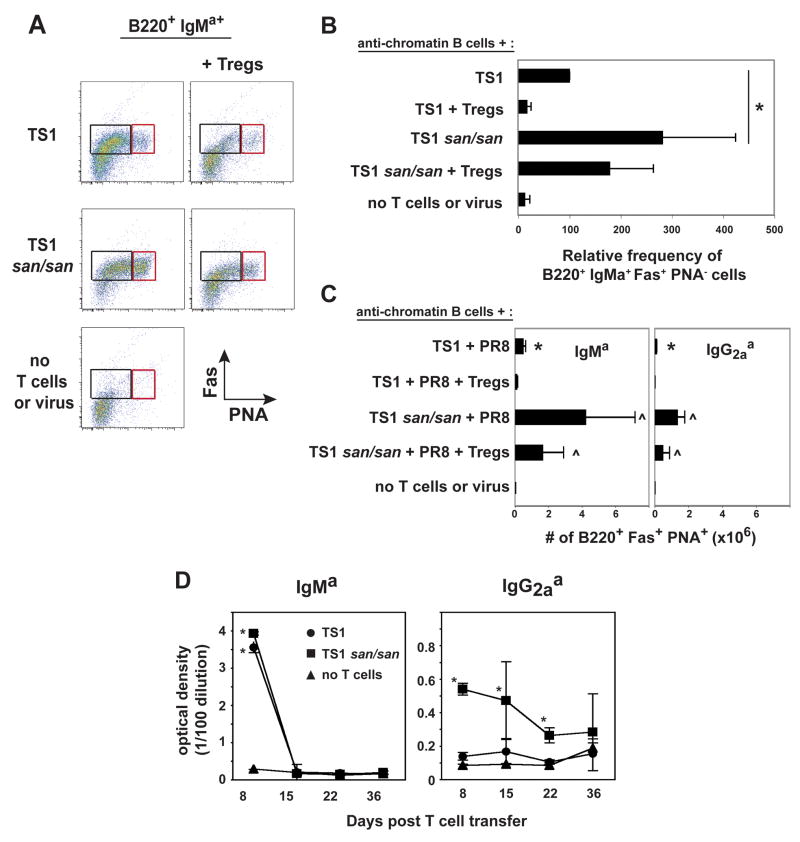
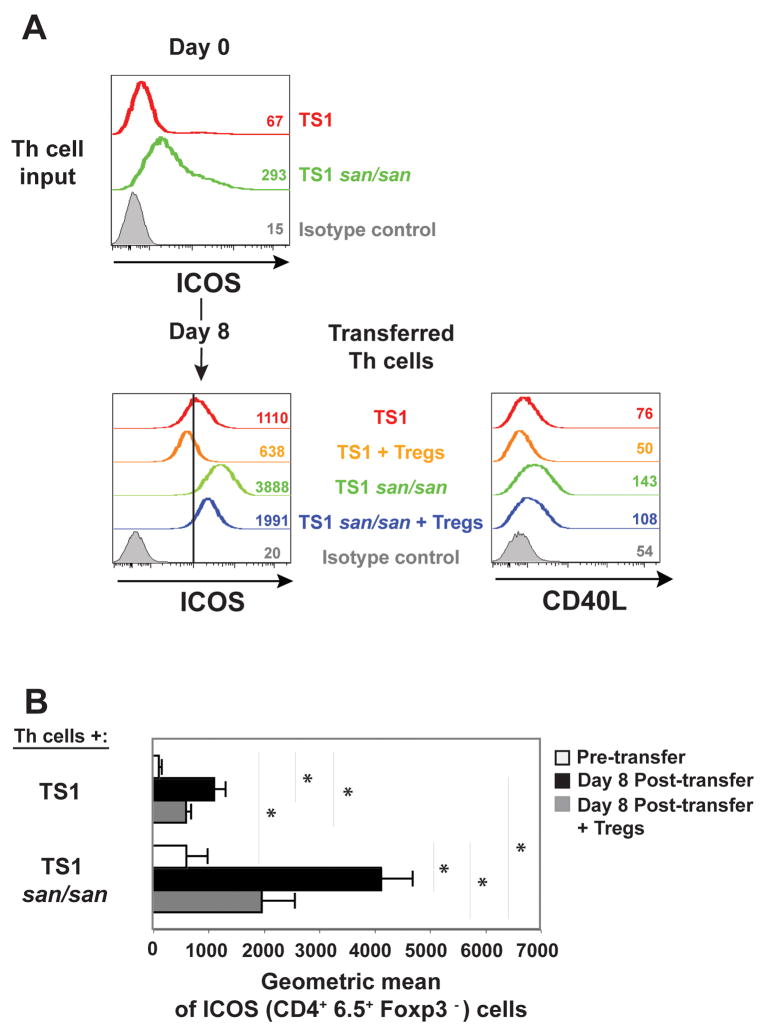
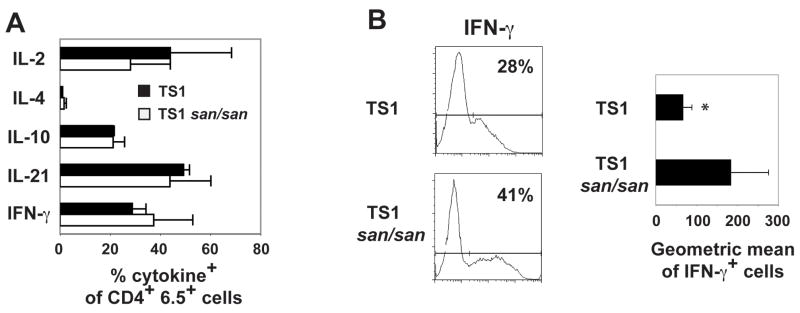
T regulatory cells are critical for the prevention of autoimmunity. Specifically, Treg cells can control anti-chromatin antibody production in vivo, and this correlates with decreased ICOS expression on CD4(+) T helper cells. Here we test the significance of high ICOS expression by T effector cells, firstly in terms of the anti-chromatin B cell response, and secondly on the ability of Treg cells to suppress T cell help. We bred CD4(+) T cell receptor transgenic mice with mice that carry the Roquin(san/san) mutation. The Roquin gene functions to limit ICOS mRNA such that CD4 T cells from mutant mice express elevated ICOS. Using an in vivo model, TS1.Roquin(san/san) Th cells were compared with wild-type TS1 Th cells with regard to their ability to help anti-chromatin B cells in the presence or absence of Treg cells. Both TS1 and TS1.Roquin(san/san) Th cells induced anti-chromatin IgM(a) antibodies, but the TS1.Roquin(san/san) Th cells resulted in the recovery of more class-switched and germinal center B cells. Neither source of Th cells were capable of inducing long-lived autoantibodies. Treg cells completely suppressed anti-chromatin IgM(a) antibody production and reduced anti-chromatin B cell recovery induced by TS1 Th cells. Importantly, this suppression was less effective when TS1.Roquin(san/san) Th cells were used. Thus, high ICOS levels on effector T cells results in autoimmunity by augmenting the autoreactive B cell response and by dampening the effect of Treg cell suppression.
Figures
Similar articles
-
Loss of Roquin induces early death and immune deregulation but not autoimmunity.J Exp Med. 2011 Aug 29;208(9):1749-56. doi: 10.1084/jem.20110578. Epub 2011 Aug 15. J Exp Med. 2011. PMID: 21844204 Free PMC article.
-
B7RP-1 blockade ameliorates autoimmunity through regulation of follicular helper T cells.J Immunol. 2009 Feb 1;182(3):1421-8. doi: 10.4049/jimmunol.182.3.1421. J Immunol. 2009. PMID: 19155489
-
CD4+ CD25+ regulatory T cells inhibit the maturation but not the initiation of an autoantibody response.J Immunol. 2005 Oct 1;175(7):4255-64. doi: 10.4049/jimmunol.175.7.4255. J Immunol. 2005. PMID: 16177065
-
Follicular Helper CD4+ T Cells, Follicular Regulatory CD4+ T Cells, and Inducible Costimulator and Their Roles in Multiple Sclerosis and Experimental Autoimmune Encephalomyelitis.Mediators Inflamm. 2021 Sep 12;2021:2058964. doi: 10.1155/2021/2058964. eCollection 2021. Mediators Inflamm. 2021. PMID: 34552387 Free PMC article. Review.
-
Regulation of T:B cell interactions by the inducible costimulator molecule: does ICOS "induce" disease?Clin Immunol. 2006 Oct;121(1):13-8. doi: 10.1016/j.clim.2006.04.574. Epub 2006 Jun 21. Clin Immunol. 2006. PMID: 16790364 Review.
Cited by
-
T regulatory cells participate in the control of germinal centre reactions.Immunology. 2011 Aug;133(4):452-68. doi: 10.1111/j.1365-2567.2011.03456.x. Epub 2011 Jun 3. Immunology. 2011. PMID: 21635248 Free PMC article.
-
Roquin--a multifunctional regulator of immune homeostasis.Genes Immun. 2016 Mar;17(2):79-84. doi: 10.1038/gene.2015.58. Epub 2015 Dec 17. Genes Immun. 2016. PMID: 26673963 Free PMC article. Review.
References
-
- Fields ML, Hondowicz BD, Wharton GN, Adair BS, Metzgarm MH, Alexander ST, Caton AJ, Erikson J. The regulation and activation of lupus-associated B cells. Immunological Reviews. 2005;204:165–183. - PubMed
-
- Seo S-j, Fields ML, Buckler JL, Reed AJ, Mandik-Nayak L, Nish SA, Noelle RJ, Turka LA, Finkelman FD, Caton AJ, et al. The impact of T helper and T regulatory cells on the regulation of anti-double-stranded DNA B cells. Immunity. 2002;16:535–546. - PubMed
-
- Fields ML, Hondowicz BD, Metzgar MH, Nish SA, Wharton GN, Picca CC, Caton AJ, Erikson J. CD4+CD25+ Regulatory T Cells Inhibit the Maturation but Not the Initiation of an Autoantibody Response. J Immunol. 2005;175:4255–64. - PubMed
-
- Sekiguchi D, Jainandunsing S, Fields M, Maldonado M, Madaio M, Erikson J, Weigert M, Eisenberg R. Chronic graft-versus-host in Ig knockin transgenic mice abrogates B cell tolerance in anti-dsDNA B cells. Journal of Immunology. 2002;168:4142–53. - PubMed
Publication types
MeSH terms
Substances
Grants and funding
LinkOut - more resources
Full Text Sources
Research Materials
