

FANCC suppresses short telomere-initiated telomere sister chromatid exchange
- PMID: 20022886
- PMCID: PMC2816614
- DOI: 10.1093/hmg/ddp556
FANCC suppresses short telomere-initiated telomere sister chromatid exchange
Abstract
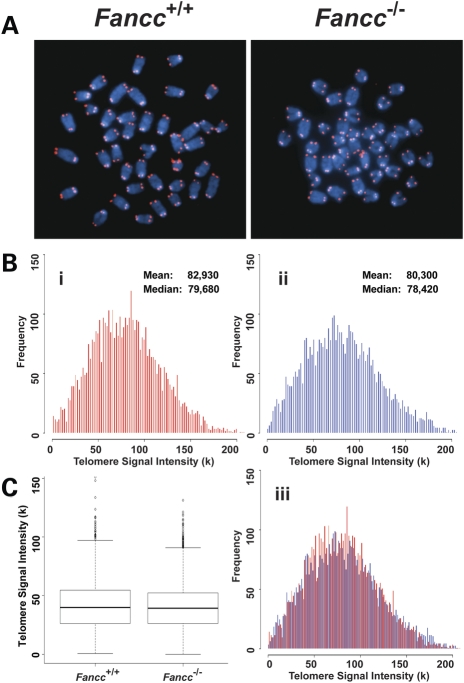
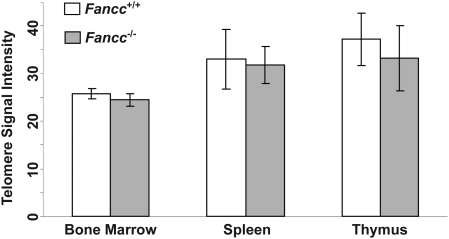
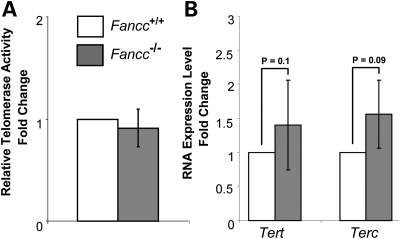
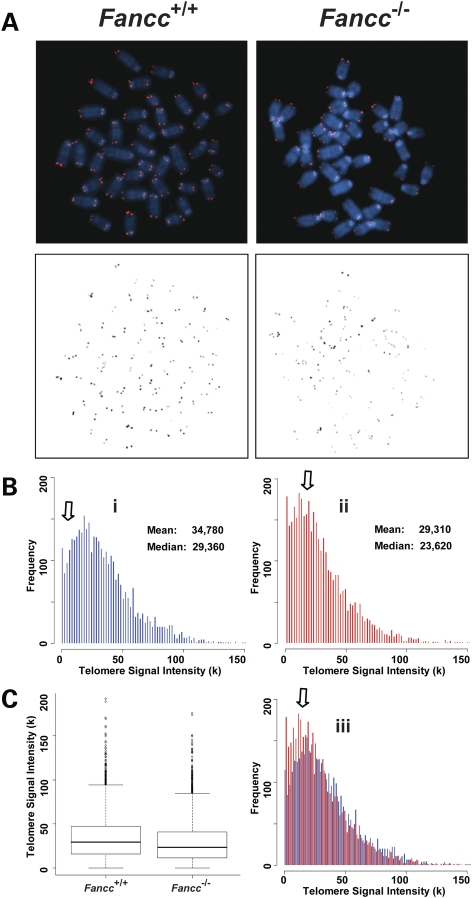
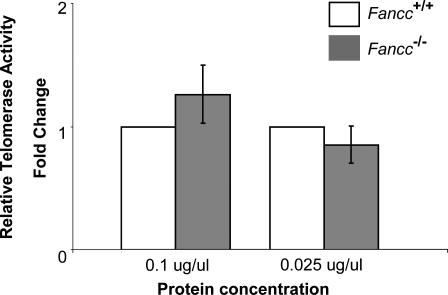
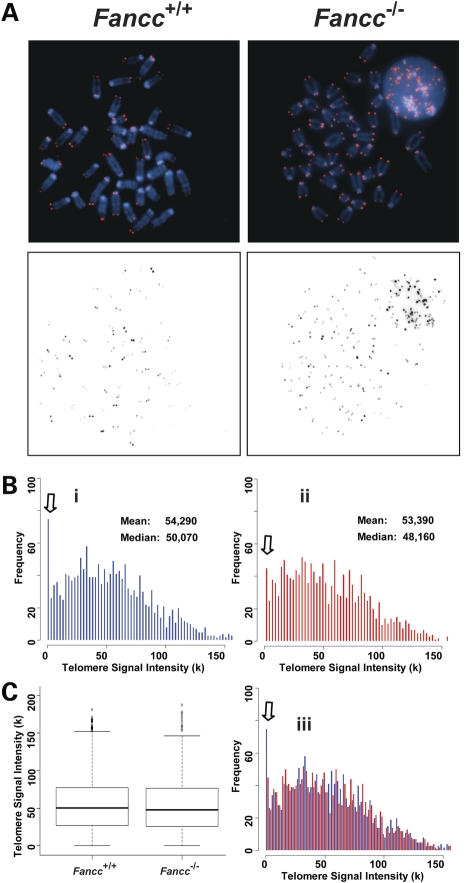
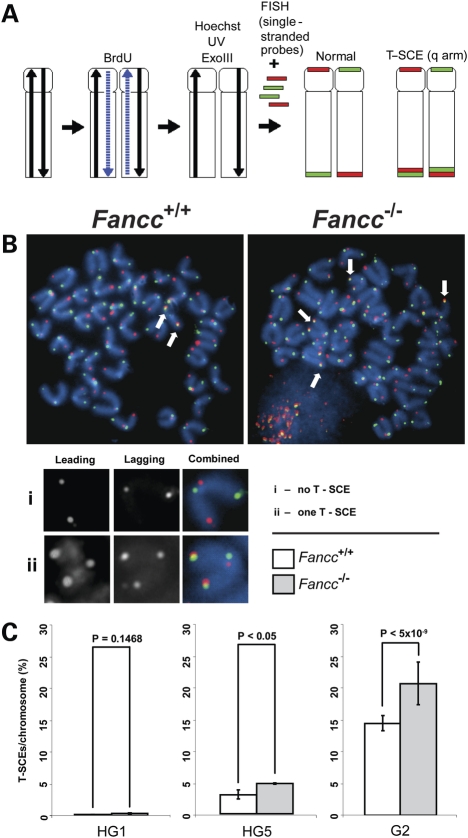
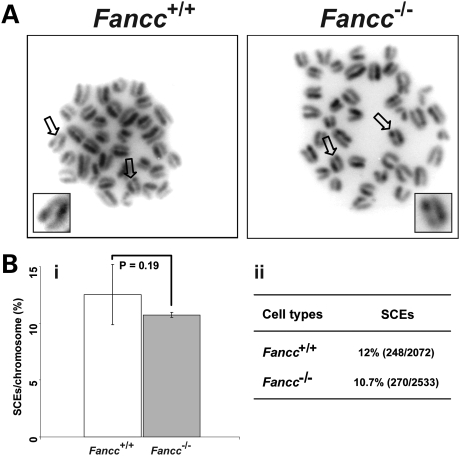
Telomere shortening has been linked to rare human disorders that present with bone marrow failure including Fanconi anemia (FA). FANCC is one of the most commonly mutated FA genes in FA patients and the FANCC subtype tends to have a relatively early onset of bone marrow failure and hematologic malignancies. Here, we studied the role of Fancc in telomere length regulation in mice. Deletion of Fancc (Fancc(-/-)) did not affect telomerase activity, telomere length or telomeric end-capping in a mouse strain possessing intrinsically long telomeres. However, ablation of Fancc did exacerbate telomere attrition when murine bone marrow cells experienced high cell turnover after serial transplantation. When Fancc(-/-) mice were crossed into a telomerase reverse transcriptase heterozygous or null background (Tert(+/-) or Tert(-/-)) with short telomeres, Fancc deficiency led to an increase in the incidence of telomere sister chromatid exchange. In contrast, these phenotypes were not observed in Tert mutant mice with long telomeres. Our data indicate that Fancc deficiency accelerates telomere shortening during high turnover of hematopoietic cells and promotes telomere recombination initiated by short telomeres.
Figures
Similar articles
-
In Fanconi anemia, impaired accumulation of bone marrow neutrophils during emergency granulopoiesis induces hematopoietic stem cell stress.J Biol Chem. 2024 Aug;300(8):107548. doi: 10.1016/j.jbc.2024.107548. Epub 2024 Jul 9. J Biol Chem. 2024. PMID: 38992437 Free PMC article.
-
An increase in telomere sister chromatid exchange in murine embryonic stem cells possessing critically shortened telomeres.Proc Natl Acad Sci U S A. 2005 Jul 19;102(29):10256-60. doi: 10.1073/pnas.0504635102. Epub 2005 Jul 6. Proc Natl Acad Sci U S A. 2005. PMID: 16000404 Free PMC article.
-
Overnight transduction with foamyviral vectors restores the long-term repopulating activity of Fancc-/- stem cells.Blood. 2008 Dec 1;112(12):4458-65. doi: 10.1182/blood-2007-07-102947. Epub 2008 Aug 6. Blood. 2008. PMID: 18684868 Free PMC article.
-
Telomere length variation and telomerase activity expression in patients with congenital and acquired aplastic anemia.Acta Haematol. 2004;111(3):125-31. doi: 10.1159/000076519. Acta Haematol. 2004. PMID: 15034232 Review.
-
Extracting extra-telomeric phenotypes from telomerase mouse models.Yonsei Med J. 2014 Jan;55(1):1-8. doi: 10.3349/ymj.2014.55.1.1. Yonsei Med J. 2014. PMID: 24339280 Free PMC article. Review.
Cited by
-
p53 downregulates the Fanconi anaemia DNA repair pathway.Nat Commun. 2016 Apr 1;7:11091. doi: 10.1038/ncomms11091. Nat Commun. 2016. PMID: 27033104 Free PMC article.
-
Beyond DNA repair and chromosome instability-Fanconi anaemia as a cellular senescence-associated syndrome.Cell Death Differ. 2021 Apr;28(4):1159-1173. doi: 10.1038/s41418-021-00764-5. Epub 2021 Mar 15. Cell Death Differ. 2021. PMID: 33723374 Free PMC article. Review.
-
Fanconi anemia proteins in telomere maintenance.DNA Repair (Amst). 2016 Jul;43:107-12. doi: 10.1016/j.dnarep.2016.02.007. Epub 2016 Apr 8. DNA Repair (Amst). 2016. PMID: 27118469 Free PMC article. Review.
-
Defective repair of uracil causes telomere defects in mouse hematopoietic cells.J Biol Chem. 2015 Feb 27;290(9):5502-11. doi: 10.1074/jbc.M114.607101. Epub 2015 Jan 8. J Biol Chem. 2015. PMID: 25572391 Free PMC article.
-
Short telomeres: from dyskeratosis congenita to sporadic aplastic anemia and malignancy.Transl Res. 2013 Dec;162(6):353-63. doi: 10.1016/j.trsl.2013.05.003. Epub 2013 Jun 1. Transl Res. 2013. PMID: 23732052 Free PMC article. Review.
References
-
- Blackburn E.H. Switching and signaling at the telomere. Cell. 2001;106:661–673. - PubMed
-
- Greider C.W. Telomerase RNA levels limit the telomere length equilibrium. Cold Spring Harb. Symp. Quant. Biol. 2006;71:225–229. - PubMed
-
- d'Adda di Fagagna F., Teo S.H., Jackson S.P. Functional links between telomeres and proteins of the DNA-damage response. Genes Dev. 2004;18:1781–1799. - PubMed
-
- de Lange T. Shelterin: the protein complex that shapes and safeguards human telomeres. Genes Dev. 2005;19:2100–2110. - PubMed
-
- Blasco M.A., Lee H.W., Hande M.P., Samper E., Lansdorp P.M., DePinho R.A., Greider C.W. Telomere shortening and tumor formation by mouse cells lacking telomerase RNA. Cell. 1997;91:25–34. - PubMed
Publication types
MeSH terms
Substances
Grants and funding
LinkOut - more resources
Full Text Sources
Molecular Biology Databases
