. 2010 Mar 5;285(10):7254-70.
doi: 10.1074/jbc.M109.073387. Epub 2009 Dec 17.

PemK toxin of Bacillus anthracis is a ribonuclease: an insight into its active site, structure, and function

Affiliations

PemK toxin of Bacillus anthracis is a ribonuclease: an insight into its active site, structure, and function

Shivangi Agarwal et al. J Biol Chem. .

Abstract

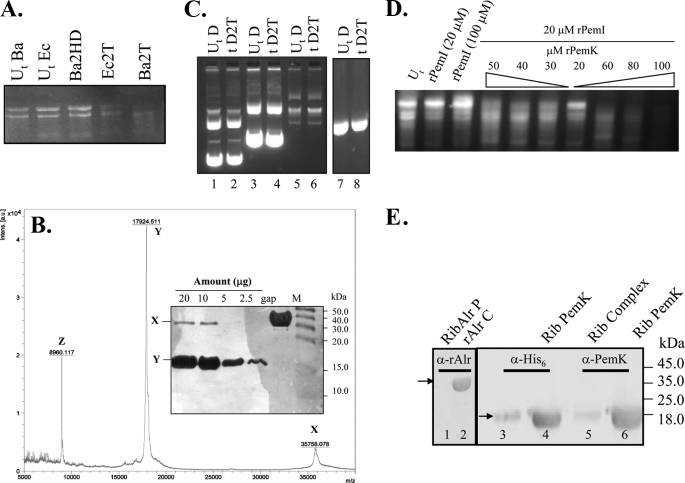
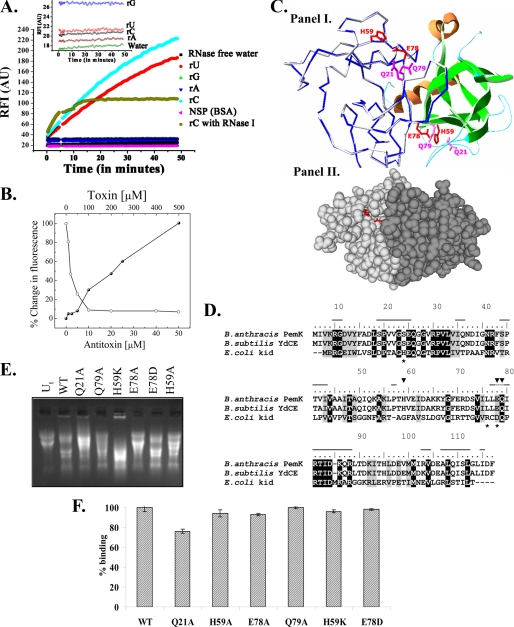
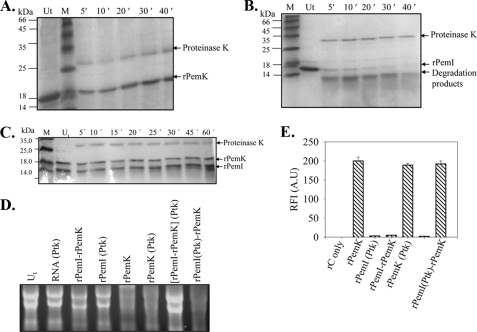
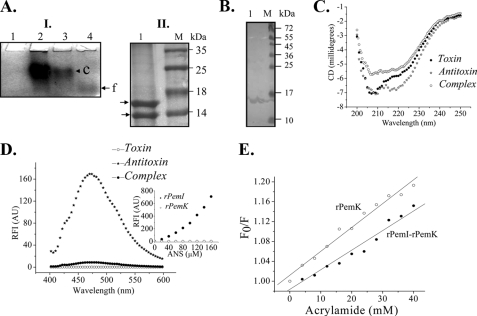
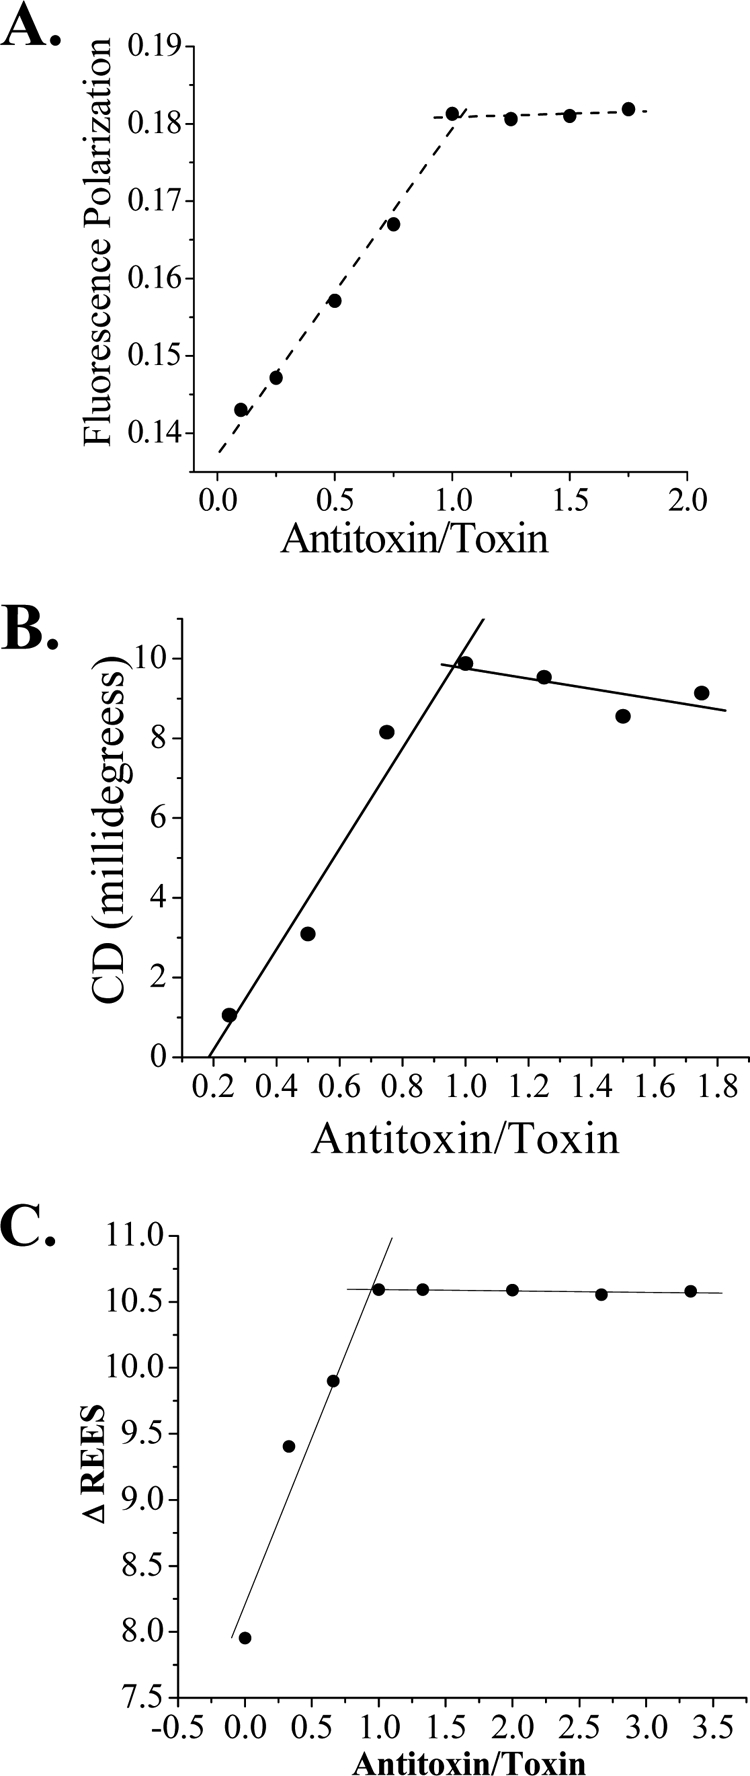
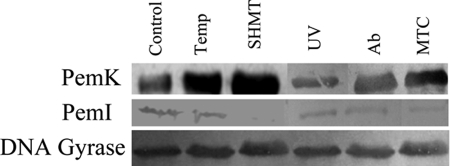
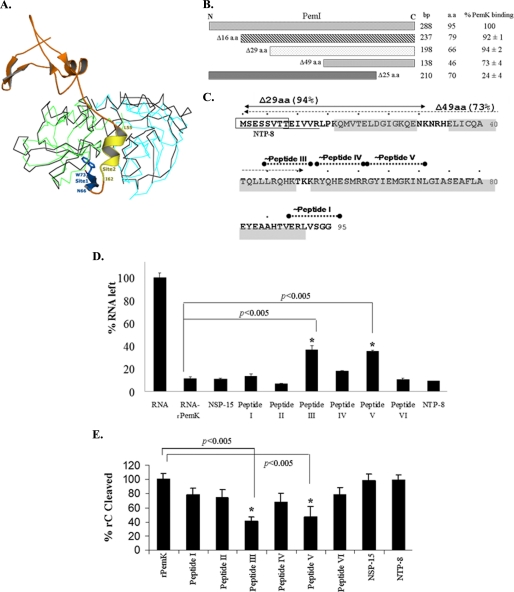
Bacillus anthracis genome harbors a toxin-antitoxin (TA) module encoding pemI (antitoxin) and pemK (toxin). This study describes the rPemK as a potent ribonuclease with a preference for pyrimidines (C/U), which is consistent with our previous study that demonstrated it as a translational attenuator. The in silico structural modeling of the PemK in conjunction with the site-directed mutagenesis confirmed the role of His-59 and Glu-78 as an acid-base couple in mediating the ribonuclease activity. The rPemK is shown to form a complex with the rPemI, which is in line with its function as a TA module. This rPemI-rPemK complex becomes catalytically inactive when both the proteins interact in a molar stoichiometry of 1. The rPemI displays vulnerability to proteolysis but attains conformational stability only upon rPemK interaction. The pemI-pemK transcript is shown to be up-regulated upon stress induction with a concomitant increase in the amount of PemK and a decline in the PemI levels, establishing the role of these modules in stress. The artificial perturbation of TA interaction could unleash the toxin, executing bacterial cell death. Toward this end, synthetic peptides are designed to disrupt the TA interaction. The peptides are shown to be effective in abrogating TA interaction in micromolar range in vitro. This approach can be harnessed as a potential antibacterial strategy against anthrax in the future.


Figures

FIGURE 1.
FIGURE 1.
A, PemK is a ribonuclease. Ten μg of RNA isolated from both E. coli and B. anthracis (abbreviated as Ec and Ba, respectively) were added to the rPemK at 25 °C for 15 min. 1st and 2nd lanes, untreated RNA (UtBa and UtEc) without the rPemK; 3rd lane, 2 μg of the heat-denatured (Ba2HD) rPemK with B. anthracis cellular RNA; 4th and 5th lanes, 2 μg of the rPemK with E. coli (Ec2T) and B. anthracis RNA (Ba2T), respectively. B, MALDI-TOF mass spectrometry profile of the rPemK of B. anthracis. X depicts a peak (m/z) at 35,758.078 indicating dimeric species (2MH+), and Y depicts a major peak at 17,924.511 indicating predominance of monomeric species (MH+). Z depicts a peak at m/z of 8960.117 corresponding to the doubly charged species, M2H+. The inset shows silver-stained SDS-PAG loaded with the indicated amounts of protein (μg); M depicts the molecular mass standards, and gap is glyceraldehyde-3-phosphate dehydrogenase (∼38.0 kDa) of B. anthracis loaded as a control protein. C, PemK cannot cleave any form of DNA. D depicts DNA; 2T depicts 2 μg of the rPemK; Ut and t represent untreated and treated DNA, respectively. Lanes 2, 4, and 6 represent circular double-stranded DNA (4, 6, and 9 kb) with 2 μg of the rPemK. Lanes 1, 3, and 5 represent untreated plasmids (UtD). Lanes 7 and 8 represent 600-bp linear double-stranded DNA (UtD) and with 2 μg of the rPemK (tD2T), respectively. D, inhibition of the RNA cleavage upon addition of the rPemI. 1st lane, B. anthracis total RNA untreated (Ut); 2nd and 3rd lanes, B. anthracis total RNA with 20 and 100 μm of rPemI alone; 4th to 7th lanes, B. anthracis RNA and 20 μm rPemI with decreasing concentrations of the rPemK (50 to 20 μm); 8th to 10th lanes, B. anthracis RNA and 20 μm rPemI with increasing concentrations of rPemK (60–100 μm). E, ribosome (Rib) binding activity of the rPemK in an in vitro assay. Antibodies directed against either the His6 tag (1:5000) or anti-PemK antibody (1:10,000) were used. Pellet fraction of alanine racemase (rAlr) with ribosomes is shown in lane 1; alanine racemase as a loading control (rAlr C) (lane 2) was probed with a 1:5000 dilution of anti-alanine racemase polyclonal antiserum; rPemI-rPemK complex in an equimolar ratio is shown in lane 3, and rPemK is shown in lane 4. Lanes 5 and 6 were similar to lanes 3 and 4, respectively, but probed with anti-rPemK polyclonal antibody.
FIGURE 2.
FIGURE 2.
A, specificity of the rPemK ribonuclease. 20 μm oligonucleotide substrates were used. rA (filled blue inverted triangles), rG (filled green triangles), rC (filled blue diamonds), and rU (filled red circles) were incubated with the rPemK (500 ng), and an increase in 6-carboxyfluorescein fluorescence was monitored by exciting the samples at 485 nm and recording the emission at 530 nm as a function of time. Intrinsic autofluorescence of the substrates is shown as an inset. Brown circles and pink triangles depict ribonuclease A from bovine pancreas, and 1 μg of bovine serum albumin (BSA) was added to a solution of 20 μm rC substrate as a positive and a negative control, respectively. NSP, nonspecific protein. B, inhibition of ribonuclease activity of the rPemK by rPemI at 1:1 stoichiometry. 30 μm of the oligonucleotide substrate rC was incubated either with the rPemK (10 μm) alone or with the rPemI (0–50 μm), and an increase in 6-carboxyfluorescein fluorescence was monitored by exciting the samples at 485 nm and recording the emission at 530 nm as a function of time. The fluorescence obtained with 10 μm rPemK was taken as 100%, and the percentage decrease in the fluorescence intensities was plotted in each case and depicted as open circles. Also, the rPemI (50 μm) was titrated against increasing rPemK concentrations (0–500 μm), and the percent increase in fluorescence intensity in each case was calculated as described and depicted as closed circles. C, panel I, structural modeling of the PemK dimer. The monomer on the left shows the Cα trace of the PemK model (blue) superimposed upon the YdcE (gray). The monomer on the right is shown as a schematic. The helices are shown in orange, sheets in green, and loop regions in cyan. The catalytic base, Glu-78, the catalytic acid, His-59 (both shown as red sticks), and the stabilizing residues, Gln-21 and Gln-79 (both as magenta sticks), are shown. Panel II, two PemK monomers are shown in a space fill mode in different shades of gray. The side chains of the catalytic residues, His-59 and Glu-78, are shown in red sticks. The figure rendering was accomplished using PyMOL (Delano Scientific). D, multiple sequence alignment of PemK, YdcE, and Kid. The similar residues are shaded gray, and the identical residues are shaded black. The dashes on top of the sequence of B. anthracis PemK show the residues involved in forming the dimer interface. The asterisks below the kid sequence denote the catalytic residues in Kid, and the inverted triangles indicate the catalytic residues of the PemK as inferred from the sequence comparison and examination of the modeled PemK structure. E, ribonuclease activity of the rPemK mutants. 10 μg of B. anthracis RNA was incubated with 2 μg of the wild type rPemK (2nd lane), Q21A.rPemK (3rd lane), Q79A.rPemK (4th lane), H59K.rPemK (5th lane), E78A.rPemK (6th lane), E78D.rPemK (7th lane), and H59A.rPemK (8th lane). 1st lane (Ut, untreated RNA) contains 10 μg of intact RNA isolated from B. anthracis. F, wild type (WT) rPemK and its mutants are able to interact with the rPemI proficiently. 500 ng of the rPemK and its mutants were coated followed by the addition of 500 ng of the rPemI. The bound protein was captured by mouse anti-rPemI polyclonal antiserum. The absorbance of the captured anti-mouse IgG-horseradish peroxidase was measured after substrate addition at 630 nm. The binding of the wild type rPemK to the rPemI was taken as 100%. The bars depict mean ± S.D. of three independent experiments.
FIGURE 3.
FIGURE 3.
PemI is sensitive to proteinase K treatment unlike PemK. Coomassie Blue-stained SDS-PAG depicting the proteolysis of the rPemK and the rPemI with proteinase K (10 μg/ml) was analyzed at the indicated time intervals. Lane Ut represents untreated proteins, rPemK (A), rPemI (B), and the rPemI-rPemK complex (C). M indicates the molecular mass standards. The indicated proteins were incubated either with 10 μg of total bacterial RNA (D) or with 20 μm rC fluorigenic substrate, and the RFI(AU) are plotted on the y axis that reflects the extent of substrate cleavage (E). The rPemK (Ptk) and rPemI (Ptk) denotes proteinase K-treated rPemK and rPemI, respectively; and (rPemI-rPemK) (Ptk) depicts preformed rPemI-rPemK complex treated with proteinase K, and rPemI(Ptk)-rPemK depicts rPemI treated with proteinase K prior to the formation of complex with the rPemK.
FIGURE 4.
FIGURE 4.
rPemK and the rPemI interact in vitro. A, native PAG. Panel I, lane 1, rPemI alone; lane 2, rPemI (50 μm), rPemK (50 μm) complex; and lane 3, rPemI (50 μm), rPemK (25 μm) complex. The slower migrating complex (c) is shown by an arrowhead and the free rPemK (f) by an arrow. Panel II, gel band corresponding to the complex (c) in lane 2 of panel I was sliced and electrophoresed on 16% SDS-PAG. Lane M represents molecular mass standards as follows: lane 1, arrows indicating ∼18- and ∼14-kDa bands corresponding to the rPemK and rPemI, respectively, separated from the complex on SDS-PAG. B, blot overlay assay. Lane 1, rPemI was run on a 12% SDS-PAG and was transblotted onto nitrocellulose membrane followed by incubation with an equimolar rPemK. The blot was probed with anti-rPemK antibody followed by addition of anti-mouse alkaline phosphatase-conjugated secondary antibody. The bands were revealed by addition of 5-bromo-4-chloro-3-indolyl phosphate/nitro blue tetrazolium dye substrate solution. Lane M, molecular mass standards. C, CD spectroscopy. Conformational change following complex formation was assessed by far-UV CD spectra of 20 μm of both the proteins alone and in complex. D, ANS binding. ANS (140 μm) was added to an equimolar complex of the rPemI and rPemK, and the change in the ANS fluorescence was measured and compared with the ANS fluorescence observed with either of the proteins. Inset shows ANS fluorescence for the proteins rPemK and rPemI (25 μm) at 450 nm obtained by continuous ANS titration with 0–200 μm as a function of protein folding. E, acrylamide quenching. The rPemK alone and the rPemI-rPemK complex was titrated using 6 m acrylamide, and the emission of the fluorophore was monitored at 315 nm by exciting the samples at 280 nm. The ratio of emission intensity (F0/F) in the absence of quencher (F0) and F at a given quencher concentration was plotted in each case, and the slopes obtained for the rPemK (open circles) and the rPemI-rPemK complex (closed circles) were calculated.
FIGURE 5.
FIGURE 5.
Determination of stoichiometry of TA interaction. A, fluorescence polarization. B, CD spectroscopy. C, red edge excitation spectroscopy. The point of intersection of both the lines in a Job Plot is a direct measure of stoichiometry of interaction that is plotted on the x axis.
FIGURE 6.
FIGURE 6.
Levels of PemK and PemI proteins under stress conditions. Immunoblotting was performed by electrophoresing the crude cell lysates obtained under all the conditions and probed with anti-rPemK and anti-rPemI. Anti-DNA gyrase was used followed by addition of anti-mouse alkaline phosphatase-conjugated secondary antibody. The blot was revealed by addition of 5-bromo-4-chloro-3-indolyl phosphate/nitro blue tetrazolium dye substrate solution. SHMT, serine hydroxamate; Temp, temperature; MTC, mitomycin C.
FIGURE 7.
FIGURE 7.
A, superposition of PemK of B. anthracis and MazF of E. coli and critical sites of interaction between the MazE and MazF. The model generated for the PemK was superimposed on the MazF dimer. The two monomers of the MazF are shown in cyan and green, and MazE is shown in orange. The ribbon of the PemK dimer is shown in black. The two most critical sites of interaction (labeled as Site 1 and Site 2) between MazE and MazF in the crystal structure are shown. Trp-73 of MazE in Site 1 is shown. Residues 66–73 (blue) of MazE bind to Site 1, and residues 55–62 (yellow) bind to Site 2. These were used to propose peptide II and VI, respectively. The figure rendering was done with PyMOL. B, C terminus of PemI is implicated in interaction with the PemK. The binding ability of the rPemK to the deletion variants of PemI was quantitated in a standard ELISA. The binding of the full-length rPemI to the rPemK was taken as 100%. The results reflect mean ± S.D. of three independent estimations. The lengths of the deletion fragments in base pairs and amino acids (a.a.) are shown at the right. C, sequence of the PemI of B. anthracis showing secondary structure prediction and rationale for design of peptides to disrupt the PemI-PemK interaction. The residues with predicted extended structure are underlined, and the helical residues are shaded. The deletion mutants Δ29 amino acids (shown as solid arrow) and Δ49 amino acids (shown as dotted arrow) were used to determine the C-terminal part of the PemI involved in the PemK binding. Their ability to bind to the rPemK is shown as percentage in parentheses. The PemI regions on which the peptides I, III, IV, and V are based is also shown. The N-terminal octapeptide (NTP-8) is shown in a box as a nonspecific but related peptide used as a control. Site 2-specific peptides showed slight protection in RNA degradation. RNA (5 μg) (D)/rC (20 μm) (E) was added to a preincubated complex of 125 μm of the indicated peptides (x axis) and 20 μm PemK (overnight at 4 °C) for 2 h at 37 °C. The percentage of remaining RNA was quantitated by a densitometer and plotted as % RNA left with the untreated RNA being 100% (D). The RFI(AU) was monitored at 630 nm for each sample, and units obtained with the rC (20 μm) and 20 μm rPemK were taken as 100% (E). For NSP-15 and NTP-8, 15- and 8-amino acid-long nonspecific peptides were used in this study. The bars depict mean ± S.D. of three independent experiments. The Student's t test was employed to calculate the statistical significance between the indicated groups, denoted with an asterisk, which represents a p value of <0.005.

References

    1. Engelberg-Kulka H., Amitai S., Kolodkin-Gal I., Hazan R. (2006) PLoS Gen. 2, e135 - PMC - PubMed
    1. Buts L., Lah J., Dao-Thi M. H., Wyns L., Loris R. (2005) Trends Biochem. Sci. 30, 672–679 - PubMed
    1. Gerdes K., Christensen S. K., Løbner-Olesen A. (2005) Nat. Rev. Microbiol. 3, 371–382 - PubMed
    1. Agarwal S., Agarwal S., Bhatnagar R. (2007) FEBS Lett. 581, 1727–1734 - PubMed
    1. Christensen S. K., Mikkelsen M., Pedersen K., Gerdes K. (2001) Proc. Natl. Acad. Sci. U.S.A. 98, 14328–14333 - PMC - PubMed

Publication types

MeSH terms

LinkOut - more resources