. 2010 Feb 26;285(9):6091-100.
doi: 10.1074/jbc.M109.014092. Epub 2009 Dec 18.

Regulation of endoplasmic reticulum stress-induced cell death by ATF4 in neuroectodermal tumor cells

Affiliations

Regulation of endoplasmic reticulum stress-induced cell death by ATF4 in neuroectodermal tumor cells

Jane L Armstrong et al. J Biol Chem. .

Abstract

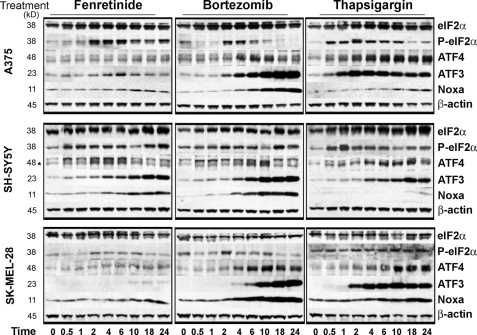
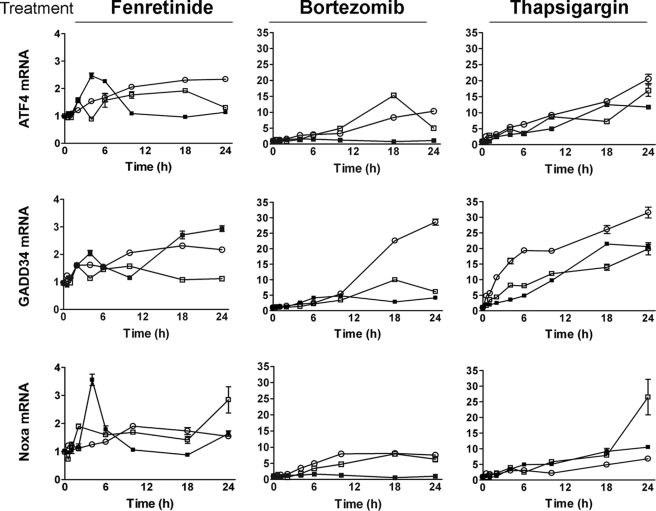
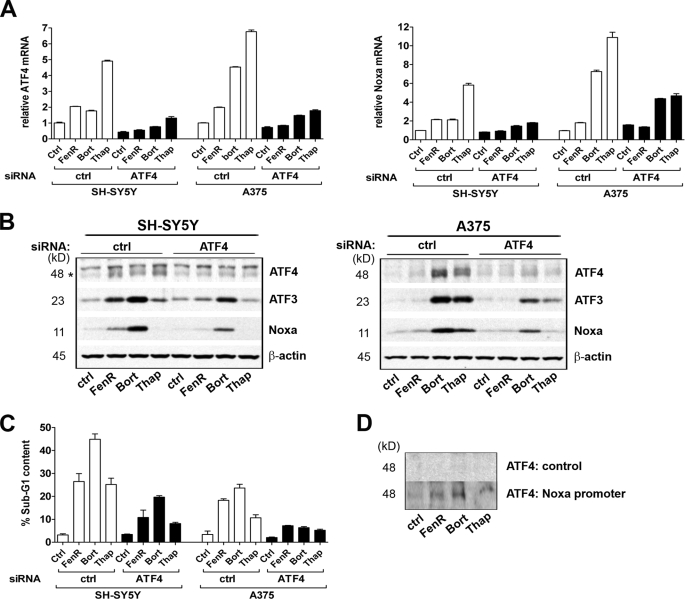
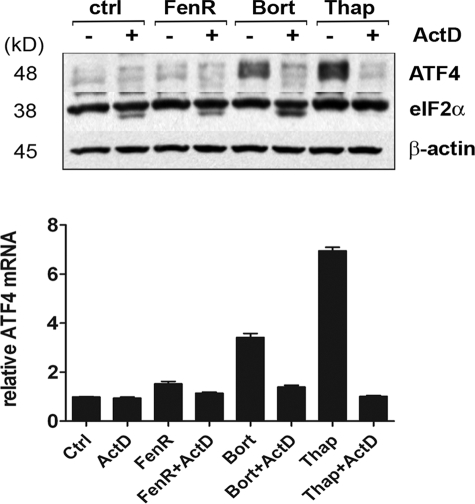
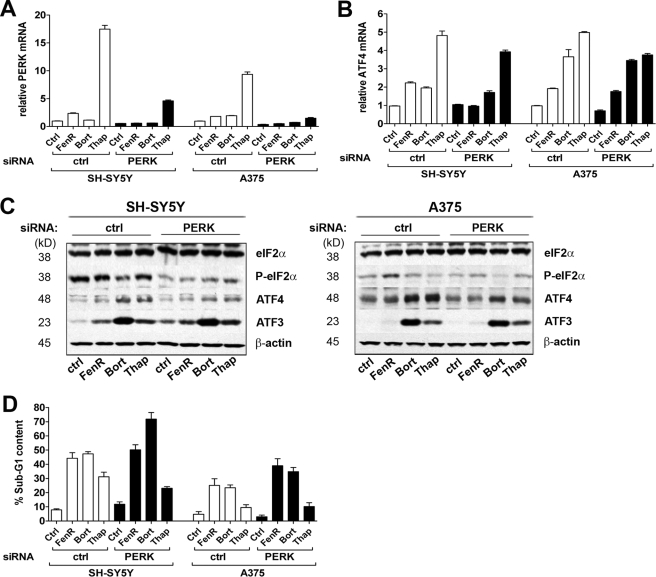
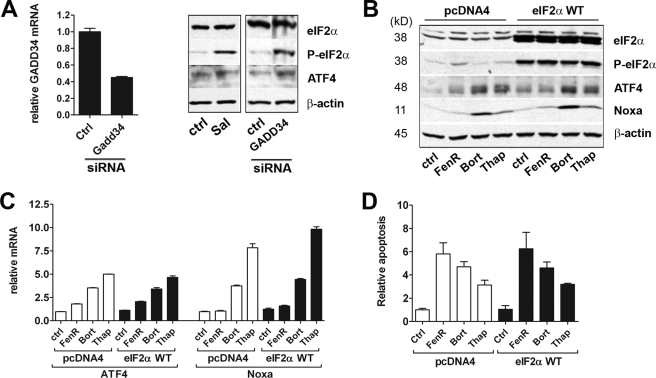
The neuroectodermal tumors neuroblastoma and melanoma represent biologically aggressive and chemoresistant cancers. The chemotherapeutic agents fenretinide and bortezomib induce apoptosis through endoplasmic reticulum (ER) stress in these tumor types. The aim of this study was to test the hypothesis that the early events of ER stress signaling and response pathways induced by fenretinide and bortezomib are mediated by the eukaryotic initiation factor 2alpha (eIF2alpha)-ATF4 signaling pathway. Treatment of neuroblastoma and melanoma cell lines with fenretinide, bortezomib, or thapsigargin resulted in induction of eIF2alpha signaling, characterized by increased expression of phosphorylated eIF2alpha, ATF4, ATF3, and GADD34. These events correlated with induction of the pro-apoptotic protein Noxa. The cytotoxic response, characterized by up-regulation of Noxa and cell death, was dependent on ATF4, but not the ER-related pro-death signaling pathways involving GADD153 or IRE1. Although PERK-dependent phosphorylation of eIF2alpha enhanced ATF4 protein levels during ER stress, cell death in response to fenretinide, bortezomib, or thapsigargin was not abrogated by inhibition of eIF2alpha phosphorylation through PERK knockdown or overexpression of wild-type eIF2alpha. Furthermore, ATF4 induction in response to ER stress was dependent primarily on transcriptional activation, which occurred in a PERK- and phosphorylated eIF2alpha-independent manner. These results demonstrate that ATF4 mediates ER stress-induced cell death of neuroectodermal tumor cells in response to fenretinide or bortezomib. Understanding the complex regulation of cell death pathways in response to ER stress-inducing drugs has the potential to reveal novel therapeutic targets, thus allowing the development of improved treatment strategies to overcome chemoresistance.


Figures

FIGURE 1.
FIGURE 1.
Fenretinide and bortezomib regulate eIF2α signaling in neuroectodermal tumor cells. Shown are Western blots for eIF2α, phospho-eIF2α, ATF4 (indicated by the asterisk), ATF3, Noxa, and β-actin in SH-SY5Y, A375, and SK-MEL-28 cells treated with fenretinide (SH-SY5Y, 5 μm; and A375/SK-MEL-28, 10 μm), bortezomib (SH-SY5Y, 5 nm; and A375/SK-MEL-28, 30 nm), or thapsigargin (SH-SY5Y, 1.5 μm; and A375/SK-MEL-28, 7.5 μm) for 0–24 h.
FIGURE 2.
FIGURE 2.
Fenretinide and bortezomib regulate eIF2α signaling in neuroectodermal tumor cells. ATF4, GADD34, or Noxa mRNA was measured by real-time PCR relative to β-actin as an internal control in SH-SY5Y (■), A375 (□), and SK-MEL-28 (○) cells treated with fenretinide (SH-SY5Y, 5 μm; and A375/SK-MEL-28, 10 μm), bortezomib (SH-SY5Y, 5 nm; and A375/SK-MEL-28, 30 nm), or thapsigargin (SH-SY5Y, 1.5 μm; and A375/SK-MEL-28, 7.5 μm) for 0–24 h. Gene expression is expressed relative to control untreated cells, and the y axis scale is 10-fold greater for the melanoma cell lines A375 and SK-MEL-28. Data are expressed as the mean ± S.E. (n = 3) and are a complete time course, consistent with n ≥ three independent experiments at 0, 6, 18, and 24 h.
FIGURE 3.
FIGURE 3.
ATF4 mediates fenretinide- and bortezomib-induced cell death. A and B, SH-SY5Y and A375 cells were transfected with siRNAs for ATF4 or with a non-silencing control siRNA (ctrl) prior to treatment with fenretinide (FenR) (SH-SY5Y, 5 μm; and A375, 10 μm), bortezomib (Bort) (SH-SY5Y, 5 nm; and A375, 30 nm), or thapsigargin (Thap) (SH-SY5Y, 1.5 μm; and A375, 7.5 μm) for 6 h. ATF4 or Noxa mRNA was measured by real-time PCR relative to β-actin as an internal control (A). ATF4 (lower band indicated by the asterisk in SH-SY5Y cells), ATF3, Noxa, and β-actin expression was determined by Western blotting (B). C, SH-SY5Y and A375 cells were transfected with siRNAs for ATF4 or with a non-silencing control siRNA prior to treatment with fenretinide (SH-SY5Y, 10 μm; and A375, 15 μm), bortezomib (SH-SY5Y, 5 nm; and A375, 50 nm), or thapsigargin (SH-SY5Y, 3 μm; and A375, 10 μm) for 24 h. Apoptosis was measured by flow cytometry of propidium iodide-stained cells to determine the sub-G1 fraction. Data are expressed as the percentage total population or relative to control untreated cells; each point is the mean ± S.E. (n ≥ 3). D, A375 cells were treated with fenretinide (15 μm), bortezomib (50 nm), or thapsigargin (10 μm) for 6 h. Recruitment to the Noxa promoter was determined by promoter pulldown assays in the absence (control) or presence of the Noxa promoter DNA fragment, followed by Western blotting for ATF4. Data are shown for whole cell extracts; similar results were obtained with nuclear extracts (not shown).
FIGURE 4.
FIGURE 4.
Transcriptional regulation of ATF4. A375 cells were treated with fenretinide (FenR; 10 μm), bortezomib (Bort; 30 nm), or thapsigargin (Thap; 7.5 μm) in the absence or presence of actinomycin D (ActD; 0.5 μm) for 10 h. ATF4, eIF2α, and β-actin expression was determined by Western blotting, and ATF4 mRNA was measured by real-time PCR and is expressed relative to β-actin. ctrl, control.
FIGURE 5.
FIGURE 5.
Fenretinide- and bortezomib-induced cell death is independent of PERK. A and B, SH-SY5Y and A375 cells were transfected with siRNAs for PERK or with a non-silencing control siRNA (ctrl) prior to treatment with fenretinide (FenR) (SH-SY5Y, 5 μm; and A375, 10 μm), bortezomib (Bort) (SH-SY5Y, 5 nm; and A375, 30 nm), or thapsigargin (Thap) (SH-SY5Y, 1.5 μm; and A375, 7.5 μm) for 6 h. PERK or ATF4 mRNA was measured by real-time PCR relative to β-actin as an internal control (A). eIF2α, phospho-eIF2α, ATF4, ATF3, and β-actin expression was determined by Western blotting (B). C, SH-SY5Y and A375 cells were transfected with siRNAs for PERK or with a non-silencing control siRNA prior to treatment with fenretinide (SH-SY5Y, 10 μm; and A375, 15 μm), bortezomib (SH-SY5Y, 5 nm; and A375, 50 nm), or thapsigargin (SH-SY5Y, 3 μm; and A375, 10 μm) for 24 h. D, apoptosis was measured by flow cytometry of propidium iodide-stained cells to determine the sub-G1 fraction. Data are expressed as the percentage total population; each point is the mean ± S.E. (n ≥ 3).
FIGURE 6.
FIGURE 6.
Role of eIF2α in fenretinide- and bortezomib-induced cell death. A, A375 cells were treated with salubrinal (Sal; 20 μm) for 18 h or transfected with siRNAs for GADD34 or with a non-silencing control siRNA (ctrl). Proteins were blotted and probed as described below; GADD34 mRNA knockdown was confirmed by real-time PCR. B and C, A375 cells were transfected with a wild-type eIF2α expression vector (eIF2α WT) or control vector pcDNA4 prior to treatment with fenretinide (FenR; 10 μm), bortezomib (Bort; 30 nm), or thapsigargin (Thap; 7.5 μm) for 6 h. eIF2α, phospho-eIF2α, ATF4, Noxa, and β-actin expression was determined by Western blotting (A and B). GADD34, ATF4, or Noxa mRNA was measured by real-time PCR relative to β-actin as an internal control (A and C). D, A375 cells were transfected with a wild-type eIF2α expression vector or control vector pcDNA4 prior to fenretinide (15 μm), bortezomib (50 nm), or thapsigargin (10 μm) treatment for 24 h. Apoptosis was measured by flow cytometry of propidium iodide-stained cells to determine the sub-G1 fraction. Data are expressed relative to control untreated cells; each point is the mean ± S.E. (n ≥ 3).

Similar articles

Cited by

References

    1. Armstrong J. L., Veal G. J., Redfern C. P., Lovat P. E. (2007) Apoptosis 12, 613–622 - PubMed
    1. Lovat P. E., Corazzari M., Armstrong J. L., Martin S., Pagliarini V., Hill D., Brown A. M., Piacentini M., Birch-Machin M. A., Redfern C. P. (2008) Cancer Res. 68, 5363–5369 - PMC - PubMed
    1. Hill D. S., Martin S., Armstrong J. L., Flockhart R., Tonison J. J., Simpson D. G., Birch-Machin M. A., Redfern C. P., Lovat P. E. (2009) Clin. Cancer Res. 15, 1192–1198 - PMC - PubMed
    1. Brignole C., Marimpietri D., Pastorino F., Nico B., Di Paolo D., Cioni M., Piccardi F., Cilli M., Pezzolo A., Corrias M. V., Pistoia V., Ribatti D., Pagnan G., Ponzoni M. (2006) J. Natl. Cancer Inst. 98, 1142–1157 - PubMed
    1. Qin J. Z., Xin H., Sitailo L. A., Denning M. F., Nickoloff B. J. (2006) Cancer Res. 66, 9636–9645 - PubMed

Publication types

MeSH terms