

RNA-Seq gene expression estimation with read mapping uncertainty
- PMID: 20022975
- PMCID: PMC2820677
- DOI: 10.1093/bioinformatics/btp692
RNA-Seq gene expression estimation with read mapping uncertainty
Abstract
Motivation: RNA-Seq is a promising new technology for accurately measuring gene expression levels. Expression estimation with RNA-Seq requires the mapping of relatively short sequencing reads to a reference genome or transcript set. Because reads are generally shorter than transcripts from which they are derived, a single read may map to multiple genes and isoforms, complicating expression analyses. Previous computational methods either discard reads that map to multiple locations or allocate them to genes heuristically.
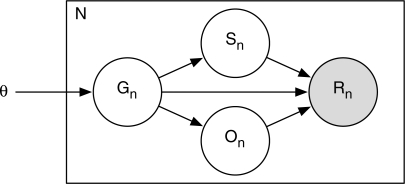
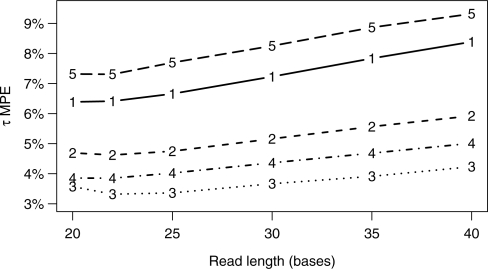
Results: We present a generative statistical model and associated inference methods that handle read mapping uncertainty in a principled manner. Through simulations parameterized by real RNA-Seq data, we show that our method is more accurate than previous methods. Our improved accuracy is the result of handling read mapping uncertainty with a statistical model and the estimation of gene expression levels as the sum of isoform expression levels. Unlike previous methods, our method is capable of modeling non-uniform read distributions. Simulations with our method indicate that a read length of 20-25 bases is optimal for gene-level expression estimation from mouse and maize RNA-Seq data when sequencing throughput is fixed.
Figures
References
-
- Beissbarth T, et al. Statistical modeling of sequencing errors in SAGE libraries. Bioinformatics. 2004;20(Suppl. 1):i31–i39. - PubMed
-
- Cloonan N, et al. Stem cell transcriptome profiling via massive-scale mRNA sequencing. Nat. Methods. 2008;5:613–619. - PubMed
-
- Dempster AP, et al. Maximum likelihood from incomplete data via the EM algorithm. J. R. Stat. Soc. Ser. B (Methodol.) 1977;39:1–38.
-
- Faulkner GJ, et al. A rescue strategy for multimapping short sequence tags refines surveys of transcriptional activity by CAGE. Genomics. 2008;91:281–288. - PubMed
Publication types
MeSH terms
LinkOut - more resources
Full Text Sources
Other Literature Sources
