. 2010 Feb;56(2):291-305.
doi: 10.1373/clinchem.2009.138420. Epub 2009 Dec 18.

Automated detection of inaccurate and imprecise transitions in peptide quantification by multiple reaction monitoring mass spectrometry

Affiliations

Automated detection of inaccurate and imprecise transitions in peptide quantification by multiple reaction monitoring mass spectrometry

Susan E Abbatiello et al. Clin Chem. 2010 Feb.

Abstract

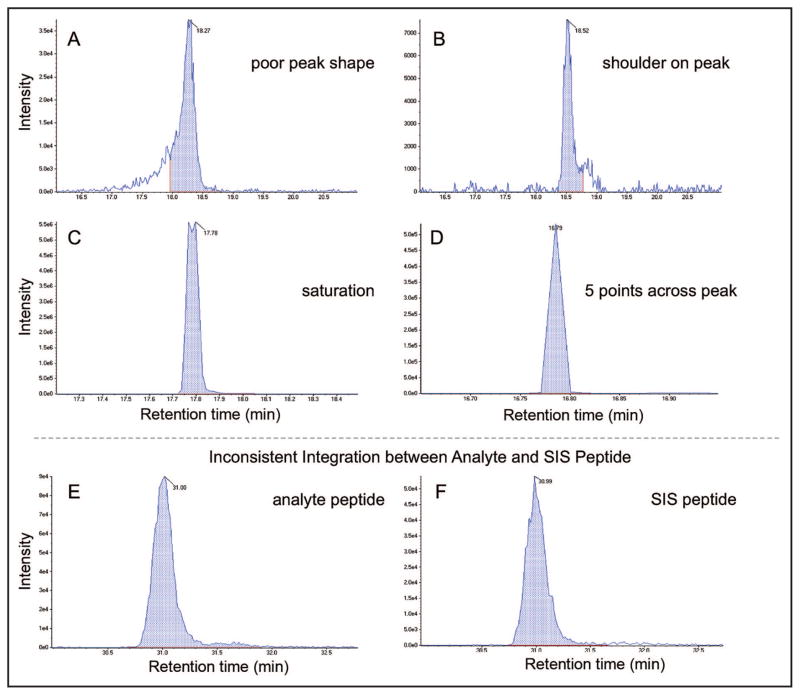
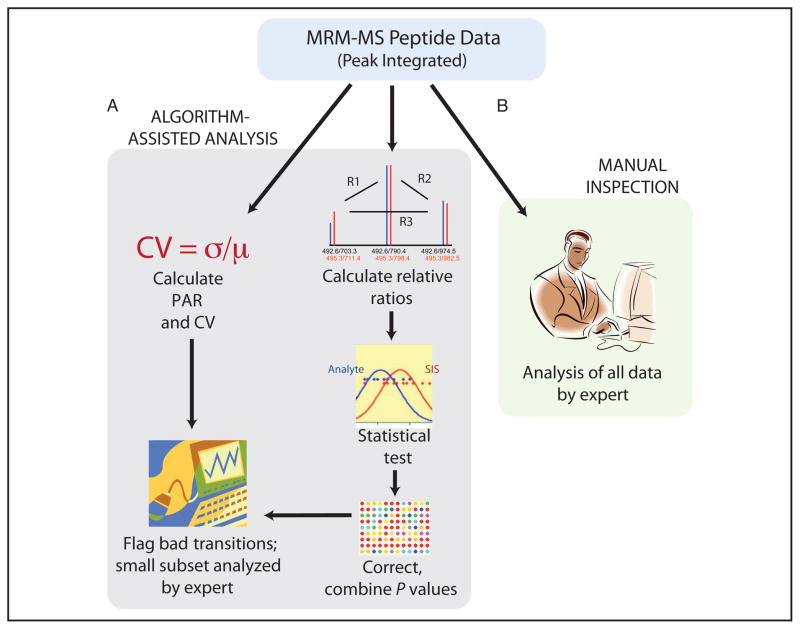
Background: Multiple reaction monitoring mass spectrometry (MRM-MS) of peptides with stable isotope-labeled internal standards (SISs) is increasingly being used to develop quantitative assays for proteins in complex biological matrices. These assays can be highly precise and quantitative, but the frequent occurrence of interferences requires that MRM-MS data be manually reviewed, a time-intensive process subject to human error. We developed an algorithm that identifies inaccurate transition data based on the presence of interfering signal or inconsistent recovery among replicate samples.

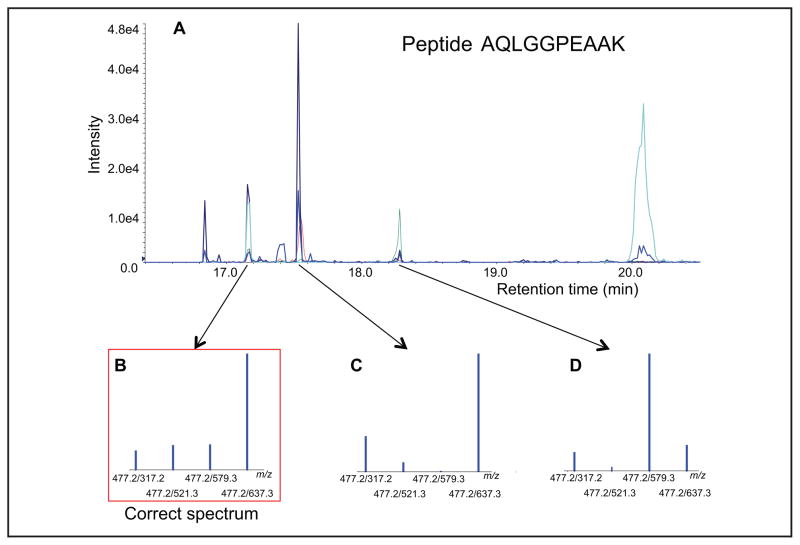
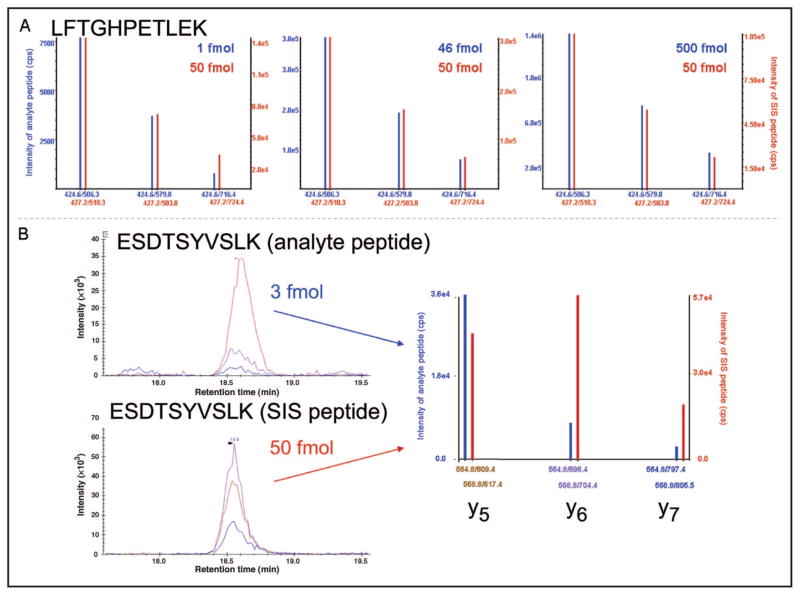
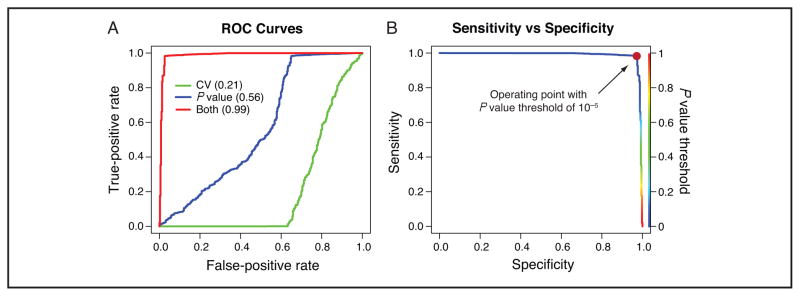
Methods: The algorithm objectively evaluates MRM-MS data with 2 orthogonal approaches. First, it compares the relative product ion intensities of the analyte peptide to those of the SIS peptide and uses a t-test to determine if they are significantly different. A CV is then calculated from the ratio of the analyte peak area to the SIS peak area from the sample replicates.

Results: The algorithm identified problematic transitions and achieved accuracies of 94%-100%, with a sensitivity and specificity of 83%-100% for correct identification of errant transitions. The algorithm was robust when challenged with multiple types of interferences and problematic transitions.

Conclusions: This algorithm for automated detection of inaccurate and imprecise transitions (AuDIT) in MRM-MS data reduces the time required for manual and subjective inspection of data, improves the overall accuracy of data analysis, and is easily implemented into the standard data-analysis work flow. AuDIT currently works with results exported from MRM-MS data-processing software packages and may be implemented as an analysis tool within such software.


Conflict of interest statement

Authors’ Disclosures of Potential Conflicts of Interest: Upon manuscript submission, all authors completed the Disclosures of Potential Conflict of Interest form. Potential conflicts of interest:

Figures

Fig. 1
Fig. 1. Inaccurate quantification in the absence of an internal standard
(A), XIC for 4 product ion transitions from the doubly charged precursor of the peptide AQLGGPEAAK in digested plasma (monitored by MRM-MS m/z 477.2 to m/z 317.2, 521.3, 579.3, and 637.2). (B–D), All 4 transitions coelute in each of 3 distinct peaks in the chromatogram between 17 min and 18.5 min.
Fig. 2
Fig. 2. Examples of MRM-MS spectra of analyte and SIS peptides in the absence (A) and presence (B) of a coeluting interference
(A), MRM mass spectra of analyte peptide (LFTGHPETLEK, blue spectra) and the corresponding heavy SIS peptide (red spectra) in digested plasma matrix. Three separate LC-MRM-MS runs are shown with a fixed amount of SIS peptide (50 fmol) and varying analyte peptide (1, 46, and 500 fmol) spiked into 1 μg digested plasma. Although the absolute intensities of the fragments (y axes) vary with concentration and potentially as a function of sample introduction into the mass spectrometer, the relative intensities of the product ions at m/z 506.3, 579.8, and 716.4 maintain a constant relationship with one another. Furthermore, the relative intensities of the analyte fragment ions agree precisely with the intensities of the fragment ions from the heavy peptide. (B), Example of an interference in peptide ESDTSYVSLK (transition y5, m/z 564.8/609.4) in digested plasma, which gives rise to an altered MRM-MS profile. The XICs are shown for the 3 transitions monitored for analyte peptide (top) and SIS peptide (bottom).
Fig. 3
Fig. 3. Examples of sources of error in quantitative measurements by MRM-MS
(A–E), XICs demonstrating common causes for incorrect quantification in SID-MRM-MS. (A), Example of poor chromatographic peak shape causing inconsistent automatic peak integration. (B), Presence of a peak with a closely eluting interference causing inconsistent integration. (C), Detector saturation at high analyte concentration. (D), Peak with <6 data points across, causing poor determination of peak area. (E, F), Comparison of the analyte and SIS peptides from the same sample, in which automatic peak integration did not use the same baseline start and stop times to determine peak area, causing inaccurate quantification.
Fig. 4
Fig. 4. Analysis work flow for isotope dilution MRM-MS data with and without the use of AuDIT
After LC-MRM-MS analysis of samples, transition peaks are identified and integrated with software from either the mass spectrometer vendor or another supplier. (A), Flow of data with use of the automated algorithm. The statistical test identifies problem transitions from the variation in the relative ratios for the analyte and the SIS. The CV of the PARs is used as a filter to flag transitions with unacceptably large variation. (B), The current standard practice of careful manual inspection of all transitions by an expert.
Fig. 5
Fig. 5. ROC curve and sensitivity–specificity plots summarizing performance of AuDIT in identifying inaccurate and imprecise transitions, as evaluated by an expert
AuDIT uses the t-test P value and the CV of the PAR (ratio of analyte peak area to SIS peak area) to detect problem transitions. (A), Both the P value and the CV are required to achieve acceptable performance (i.e., as indicated by AUC values in parentheses). (B), Specificity and sensitivity values achieved as the P value threshold is varied from 0 to 1 (with a fixed CV threshold of 20%). The chosen P value threshold of 10−5 used for all of the analyzed data is indicated by the red circle (sensitivity, 98%; specificity, 97%). The rainbow color bar (right y axis) keys the location of the P value threshold on the sensitivity–specificity curve.

References

    1. Yost RA, Enke CG. Triple quadrupole mass spectrometry for direct mixture analysis and structure elucidation. Anal Chem. 1979;51:1251–64. - PubMed
    1. Brumley WC, Sphon JA. Regulatory mass spectrometry. Biomed Mass Spectrom. 1981;8:390–6. - PubMed
    1. Sphon JA. Use of mass spectrometry for confirmation of animal drug residues. J Assoc Off Anal Chem. 1978;61:1247–52. - PubMed
    1. Vargo JD. Determination of sulfonic acid degradates of chloroacetanilide and chloroacetamide herbicides in groundwater by LC/MS/MS. Anal Chem. 1998;70:2699–703. - PubMed
    1. Draisci R, Palleschi L, Ferretti E, Lucentini L, Cammarata P. Quantitation of anabolic hormones and their metabolites in bovine serum and urine by liquid chromatography-tandem mass spectrometry. J Chromatogr A. 2000;870:511–22. - PubMed

Publication types