

The MG1363 and IL1403 laboratory strains of Lactococcus lactis and several dairy strains are diploid
- PMID: 20023021
- PMCID: PMC2812979
- DOI: 10.1128/JB.00900-09
The MG1363 and IL1403 laboratory strains of Lactococcus lactis and several dairy strains are diploid
Abstract
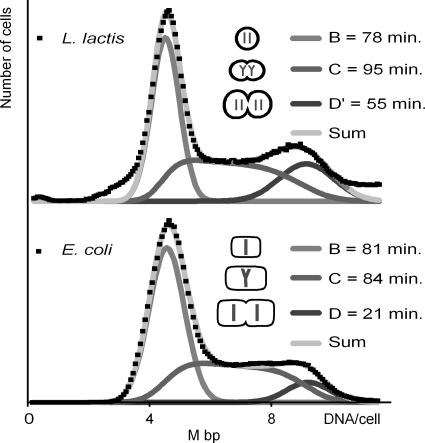
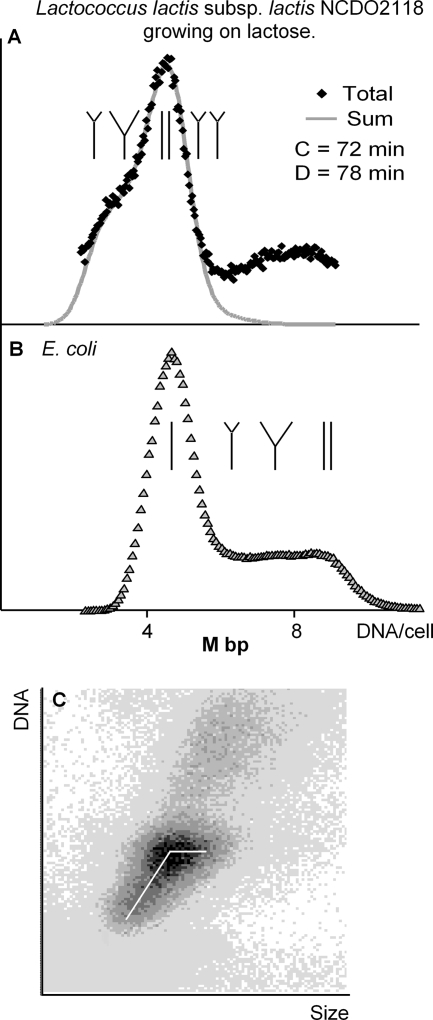
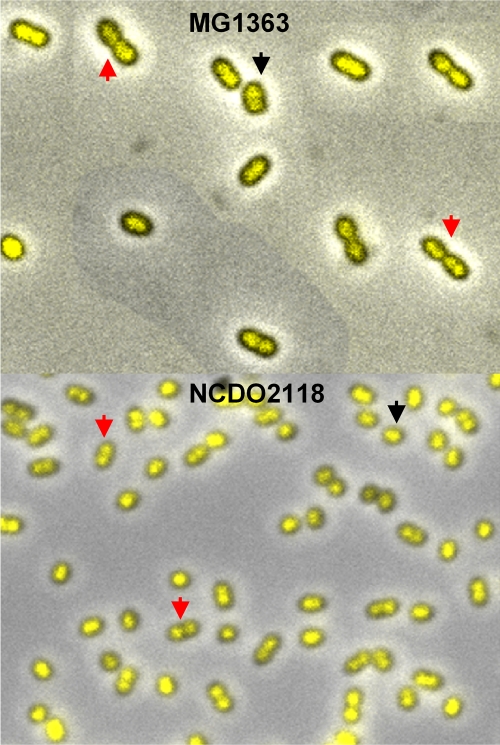
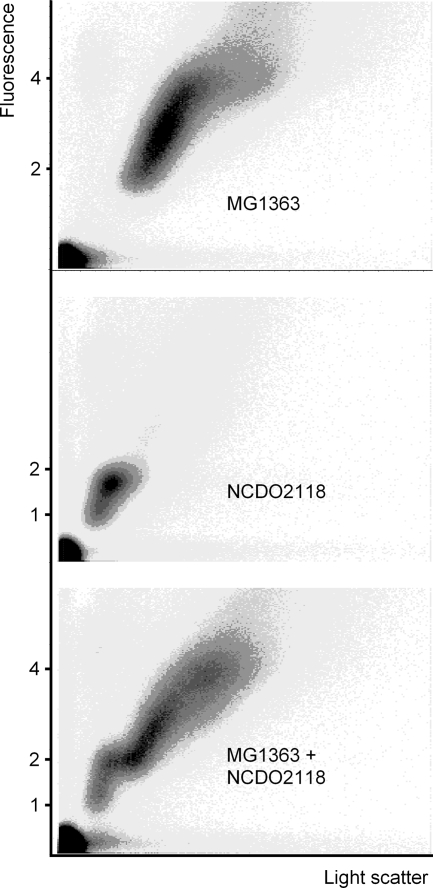
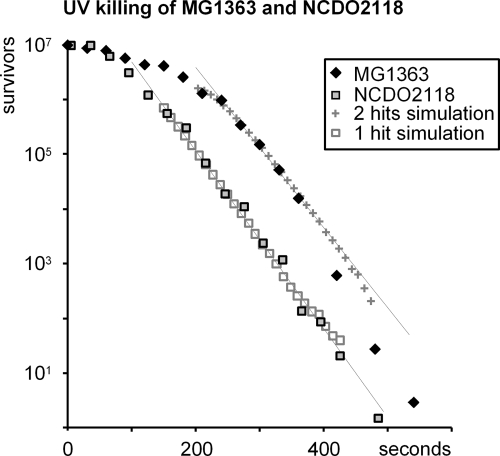
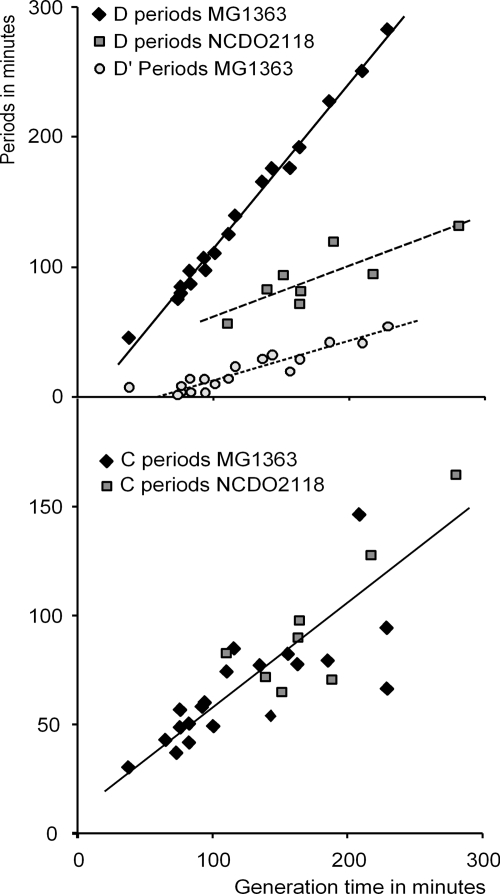
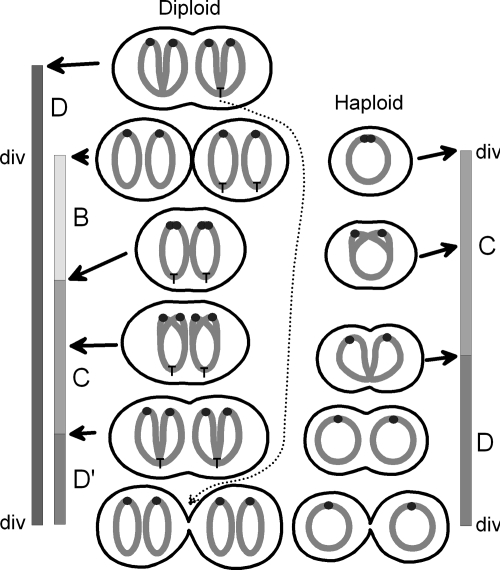
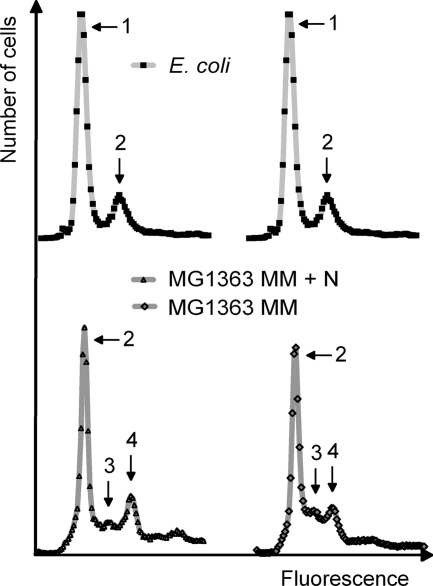
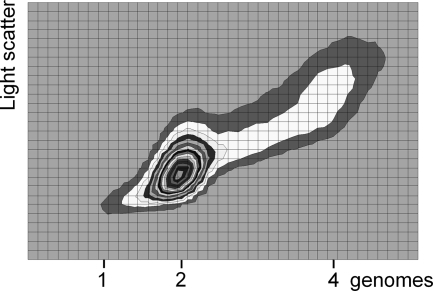
Bacteria are normally haploid, maintaining one copy of their genome in one circular chromosome. We have examined the cell cycle of laboratory strains of Lactococcus lactis, and, to our surprise, we found that some of these strains were born with two complete nonreplicating chromosomes. We determined the cellular content of DNA by flow cytometry and by radioactive labeling of the DNA. These strains thus fulfill the criterion of being diploid. Several dairy strains were also found to be diploid while a nondairy strain and several other dairy strains were haploid in slow-growing culture. The diploid and haploid strains differed in their sensitivity toward UV light, in their cell size, and in their D period, the period between termination of DNA replication and cell division.
Figures
Similar articles
-
Physical and genetic map of the chromosome of Lactococcus lactis subsp. lactis IL1403.J Bacteriol. 1992 Nov;174(21):6752-62. doi: 10.1128/jb.174.21.6752-6762.1992. J Bacteriol. 1992. PMID: 1328163 Free PMC article.
-
Physical and genetic map of the Lactococcus lactis subsp. cremoris MG1363 chromosome: comparison with that of Lactococcus lactis subsp. lactis IL 1403 reveals a large genome inversion.J Bacteriol. 1995 May;177(10):2840-50. doi: 10.1128/jb.177.10.2840-2850.1995. J Bacteriol. 1995. PMID: 7751295 Free PMC article.
-
Physical and genetic maps of the chromosome of the Lactococcus lactis subsp. lactis strain IL1403 and Lactococcus lactis subsp. cremoris strain MG1363.Dev Biol Stand. 1995;85:597-603. Dev Biol Stand. 1995. PMID: 8586238 Review. No abstract available.
-
pSEUDO, a genetic integration standard for Lactococcus lactis.Appl Environ Microbiol. 2011 Sep;77(18):6687-90. doi: 10.1128/AEM.05196-11. Epub 2011 Jul 15. Appl Environ Microbiol. 2011. PMID: 21764949 Free PMC article.
-
Low-redundancy sequencing of the entire Lactococcus lactis IL1403 genome.Antonie Van Leeuwenhoek. 1999 Jul-Nov;76(1-4):27-76. Antonie Van Leeuwenhoek. 1999. PMID: 10532372 Review.
Cited by
-
Selection systems based on dominant-negative transcription factors for precise genetic engineering.Nucleic Acids Res. 2010 Oct;38(19):e183. doi: 10.1093/nar/gkq708. Epub 2010 Aug 11. Nucleic Acids Res. 2010. PMID: 20702421 Free PMC article.
-
Polyploidy in haloarchaea: advantages for growth and survival.Front Microbiol. 2014 Jun 13;5:274. doi: 10.3389/fmicb.2014.00274. eCollection 2014. Front Microbiol. 2014. PMID: 24982654 Free PMC article. Review.
-
Oxidative stress at high temperatures in Lactococcus lactis due to an insufficient supply of Riboflavin.Appl Environ Microbiol. 2013 Oct;79(19):6140-7. doi: 10.1128/AEM.01953-13. Epub 2013 Aug 2. Appl Environ Microbiol. 2013. PMID: 23913422 Free PMC article.
-
Food environments select microorganisms based on selfish energetic behavior.Front Microbiol. 2013 Nov 22;4:348. doi: 10.3389/fmicb.2013.00348. eCollection 2013. Front Microbiol. 2013. PMID: 24319442 Free PMC article.
-
An extreme thermophile, Thermus thermophilus, is a polyploid bacterium.J Bacteriol. 2010 Oct;192(20):5499-505. doi: 10.1128/JB.00662-10. Epub 2010 Aug 20. J Bacteriol. 2010. PMID: 20729360 Free PMC article.
References
-
- Blattner, F. R., G. Plunkett, III, C. A. Bloch, N. T. Perna, V. Burland, M. Riley, J. Collado-Vides, J. D. Glasner, C. K. Rode, G. F. Mayhew, J. Gregor, N. W. Davis, H. A. Kirkpatrick, M. A. Goeden, D. J. Rose, B. Mau, and Y. Shao. 1997. The complete genome sequence of Escherichia coli K-12. Science 277:1453-1474. - PubMed
-
- Bresler, V., and L. Fishelson. 2003. Polyploidy and polyteny in the gigantic eubacterium Epulopiscium fishelsoni. Mar. Biol. 143:17-21.
-
- Chopin, A., M. C. Chopin, A. Moillo-Batt, and P. Langella. 1984. Two plasmid-determined restriction and modification systems in Streptococcus lactis. Plasmid 11:260-263. - PubMed
-
- Cooper, S., and C. E. Helmstetter. 1968. Chromosome replication and the division cycle of Escherichia coli B/r. J. Mol. Biol. 31:519-540. - PubMed
-
- Defoor, E., M. B. Kryger, and J. Martinussen. 2007. The orotate transporter encoded by oroP from Lactococcus lactis is required for orotate utilization and has utility as a food-grade selectable marker. Microbiology 153:3645-3659. - PubMed
Publication types
MeSH terms
Substances
LinkOut - more resources
Full Text Sources
