

doi: 10.1128/AEM.01372-09.
Epub 2009 Dec 18.
Direct-imaging-based quantification of Bacillus cereus ATCC 14579 population heterogeneity at a low incubation temperature
Affiliations
- PMID: 20023091
- PMCID: PMC2813029
- DOI: 10.1128/AEM.01372-09
Item in Clipboard
Direct-imaging-based quantification of Bacillus cereus ATCC 14579 population heterogeneity at a low incubation temperature
Appl Environ Microbiol.
2010 Feb.
Abstract
Bacillus cereus ATCC 14579 was cultured in microcolonies on Anopore strips near its minimum growth temperature to directly image and quantify its population heterogeneity at an abusive refrigeration temperature. Eleven percent of the microcolonies failed to grow during low-temperature incubation, and this cold-induced population heterogeneity could be partly attributed to the loss of membrane integrity of individual cells.
Figures
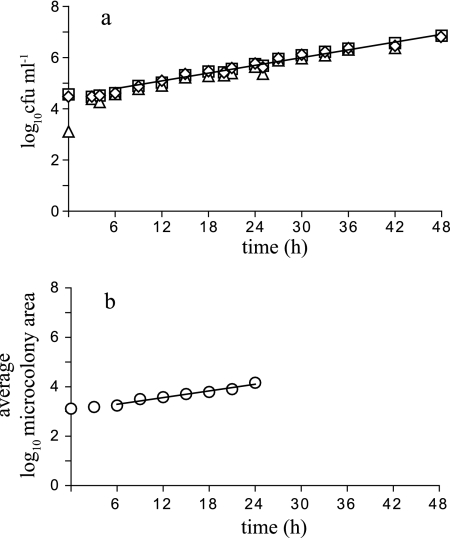
(a) Growth of Bacillus cereus ATCC 14579 in BHI broth at 12°C. Cells were plated on BHI agar plates (⋄), BHI agar plates plus 2.5% salt (□), and BHI agar plates plus 5% salt (▵). (b) Growth of microcolonies on Anopore strips placed on BHI agar plates at 12°C. The area of each microcolony per imaging time point was measured in pixels and log10 transformed. Data points represent the average microcolony size of the grown population of microcolonies per imaging time point (○). The specific growth rates in broth and on Anopore strips were estimated by linear regression using the time points that represented exponential growth (continuous lines).

Examples of images of Bacillus cereus ATCC 14579 cultured on Anopore strips which were placed upon BHI agar plates at 12°C. Observed and fitted frequency distributions of the number of cells per microcolony for the imaging time points (t) 0, 6, 12, 18, and 24 h are shown. Histogram shows observed frequencies of number of cells per microcolony. Continuous curves show fitted normal distributions of the log10-transformed microcolony areas, solid lines represent the distribution of all microcolonies, and dashed lines represent the distribution of grown microcolonies only.

The variances of the observed frequency distributions of the log10-transformed microcolony areas versus the imaging time points at 12°C and 30°C. The intervals of imaging were 3 h at 12°C and 15 min at 30°C (see reference 6). ⋄, Distribution at 12°C of all microcolonies; ♦, distribution at 12°C of grown microcolonies only; □, distribution of microcolonies at 30°C.

Labeling of Bacillus cereus ATCC 14579 microcolonies with SYTO-9 and propidium iodide after 24 h of culturing on Anopore strips which were placed upon BHI agar plates at 12°C. At this imaging time point, two populations of microcolonies were observed, a nongrown population (a) and a grown population (b).
Similar articles
-
Quantitative analysis of population heterogeneity of the adaptive salt stress response and growth capacity of Bacillus cereus ATCC 14579.Appl Environ Microbiol. 2007 Aug;73(15):4797-804. doi: 10.1128/AEM.00404-07. Epub 2007 Jun 1. Appl Environ Microbiol. 2007. PMID: 17545319 Free PMC article.
-
Psychrotrophic strains of Bacillus cereus producing enterotoxin.J Appl Bacteriol. 1990 Jul;69(1):73-9. doi: 10.1111/j.1365-2672.1990.tb02913.x. J Appl Bacteriol. 1990. PMID: 2118898
-
Involvement of the CasK/R two-component system in optimal unsaturation of the Bacillus cereus fatty acids during low-temperature growth.Int J Food Microbiol. 2015 Nov 20;213:110-7. doi: 10.1016/j.ijfoodmicro.2015.04.043. Epub 2015 May 5. Int J Food Microbiol. 2015. PMID: 25987542
-
Bacillus cereus cshA Is Expressed during the Lag Phase of Growth and Serves as a Potential Marker of Early Adaptation to Low Temperature and pH.Appl Environ Microbiol. 2019 Jul 1;85(14):e00486-19. doi: 10.1128/AEM.00486-19. Print 2019 Jul 15. Appl Environ Microbiol. 2019. PMID: 31076436 Free PMC article.
-
Media for the detection and enumeration of Bacillus cereus in foods: a review.Int J Food Microbiol. 1992 Oct;17(2):85-99. doi: 10.1016/0168-1605(92)90108-f. Int J Food Microbiol. 1992. PMID: 1486027 Review.
Cited by
-
Impact of sorbic acid on germination and outgrowth heterogeneity of Bacillus cereus ATCC 14579 spores.Appl Environ Microbiol. 2012 Dec;78(23):8477-80. doi: 10.1128/AEM.02361-12. Epub 2012 Sep 21. Appl Environ Microbiol. 2012. PMID: 23001664 Free PMC article.
-
Colonial vs. planktonic type of growth: mathematical modeling of microbial dynamics on surfaces and in liquid, semi-liquid and solid foods.Front Microbiol. 2015 Oct 29;6:1178. doi: 10.3389/fmicb.2015.01178. eCollection 2015. Front Microbiol. 2015. PMID: 26579087 Free PMC article. Review.
-
Oxygen relieves the CO2 and acetate dependency of Lactobacillus johnsonii NCC 533.PLoS One. 2013;8(2):e57235. doi: 10.1371/journal.pone.0057235. Epub 2013 Feb 26. PLoS One. 2013. PMID: 23468944 Free PMC article.
References
-
- Afchain, A. L., F. Carlin, C. Nguyen-The, and I. Albert. 2008. Improving quantitative exposure assessment by considering genetic diversity of B. cereus in cooked, pasteurised and chilled foods. Int. J. Food Microbiol. 128:165-173. - PubMed
-
- Augustin, J.-C., L. Rosso, and V. Carlier. 2000. A model describing the effect of temperature history on lag time for Listeria monocytogenes. Int. J. Food Microbiol. 57:169-181. - PubMed
-
- Brocklehurst, T. F., G. A. Mitchell, and A. C. Smith. 1997. A model experimental gel surface for the growth of bacteria on foods. Food Microbiol. 14:303-311.
-
- Carlin, F., H. Girardin, M. W. Peck, S. C. Stringer, G. C. Barker, A. Martinez, A. Fernandez, P. Fernandez, W. M. Waites, S. Movahedi, F. van Leusden, M. Nauta, R. Moezelaar, M. Del Torre, and S. Litman. 2000. Research on factors allowing a risk assessment of spore-forming pathogenic bacteria in cooked chilled foods containing vegetables: a FAIR collaborative project. Int. J. Food Microbiol. 60:117-135. - PubMed
-
- Carrasco, E., F. Pérez-Rodríguez, A. Valero, R. M. García-Gimeno, and G. Zurera. 2007. Survey of temperature and consumption patterns of fresh-cut leafy green salads: risk factors for listeriosis. J. Food Prot. 70:2407-2412. - PubMed
Publication types
MeSH terms
Substances
LinkOut - more resources
Full Text Sources
Molecular Biology Databases
