Metabolic impact of increased NADH availability in Saccharomyces cerevisiae
- PMID: 20023106
- PMCID: PMC2813004
- DOI: 10.1128/AEM.02040-09
Metabolic impact of increased NADH availability in Saccharomyces cerevisiae
Abstract
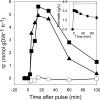
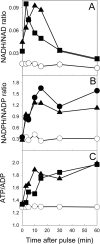
Engineering the level of metabolic cofactors to manipulate metabolic flux is emerging as an attractive strategy for bioprocess applications. We present the metabolic consequences of increasing NADH in the cytosol and the mitochondria of Saccharomyces cerevisiae. In a strain that was disabled in formate metabolism, we either overexpressed the native NAD(+)-dependent formate dehydrogenase in the cytosol or directed it into the mitochondria by fusing it with the mitochondrial signal sequence encoded by the CYB2 gene. Upon exposure to formate, the mutant strains readily consumed formate and induced fermentative metabolism even under conditions of glucose derepression. Cytosolic overexpression of formate dehydrogenase resulted in the production of glycerol, while when this enzyme was directed into the mitochondria, we observed glycerol and ethanol production. Clearly, these results point toward different patterns of compartmental regulation of redox homeostasis. When pulsed with formate, S. cerevisiae cells growing in a steady state on glucose immediately consumed formate. However, formate consumption ceased after 20 min. Our analysis revealed that metabolites at key branch points of metabolic pathways were affected the most by the genetic perturbations and that the intracellular concentrations of sugar phosphates were specifically affected by time. In conclusion, the results have implications for the design of metabolic networks in yeast for industrial applications.
Figures


Similar articles
-
Engineering NADH metabolism in Saccharomyces cerevisiae: formate as an electron donor for glycerol production by anaerobic, glucose-limited chemostat cultures.FEMS Yeast Res. 2006 Dec;6(8):1193-203. doi: 10.1111/j.1567-1364.2006.00124.x. FEMS Yeast Res. 2006. PMID: 17156016
-
Physiological and genetic engineering of cytosolic redox metabolism in Saccharomyces cerevisiae for improved glycerol production.Metab Eng. 2006 Nov;8(6):532-42. doi: 10.1016/j.ymben.2006.06.004. Epub 2006 Jun 30. Metab Eng. 2006. PMID: 16891140
-
Metabolic engineering of Escherichia coli: increase of NADH availability by overexpressing an NAD(+)-dependent formate dehydrogenase.Metab Eng. 2002 Jul;4(3):217-29. doi: 10.1006/mben.2002.0227. Metab Eng. 2002. PMID: 12616691
-
Organization and regulation of the cytosolic NADH metabolism in the yeast Saccharomyces cerevisiae.Mol Cell Biochem. 2004 Jan-Feb;256-257(1-2):73-81. doi: 10.1023/b:mcbi.0000009888.79484.fd. Mol Cell Biochem. 2004. PMID: 14977171 Review.
-
Stoichiometry and compartmentation of NADH metabolism in Saccharomyces cerevisiae.FEMS Microbiol Rev. 2001 Jan;25(1):15-37. doi: 10.1111/j.1574-6976.2001.tb00570.x. FEMS Microbiol Rev. 2001. PMID: 11152939 Review.
Cited by
-
Determining the extremes of the cellular NAD(H) level by using an Escherichia coli NAD(+)-auxotrophic mutant.Appl Environ Microbiol. 2011 Sep;77(17):6133-40. doi: 10.1128/AEM.00630-11. Epub 2011 Jul 8. Appl Environ Microbiol. 2011. PMID: 21742902 Free PMC article.
-
Ethanol production improvement driven by genome-scale metabolic modeling and sensitivity analysis in Scheffersomyces stipitis.PLoS One. 2017 Jun 28;12(6):e0180074. doi: 10.1371/journal.pone.0180074. eCollection 2017. PLoS One. 2017. PMID: 28658270 Free PMC article.
-
Electrostatic Fermentation: Molecular Response Insights for Tailored Beer Production.Foods. 2024 Feb 16;13(4):600. doi: 10.3390/foods13040600. Foods. 2024. PMID: 38397576 Free PMC article.
-
Overexpression of a Water-Forming NADH Oxidase Improves the Metabolism and Stress Tolerance of Saccharomyces cerevisiae in Aerobic Fermentation.Front Microbiol. 2016 Sep 13;7:1427. doi: 10.3389/fmicb.2016.01427. eCollection 2016. Front Microbiol. 2016. PMID: 27679617 Free PMC article.
-
Cofactor engineering improved CALB production in Pichia pastoris through heterologous expression of NADH oxidase and adenylate kinase.PLoS One. 2017 Jul 17;12(7):e0181370. doi: 10.1371/journal.pone.0181370. eCollection 2017. PLoS One. 2017. PMID: 28715469 Free PMC article.
References
-
- Abbott, D. A., R. M. Zelle, J. T. Pronk, and A. J. van Maris. 2009. Metabolic engineering of Saccharomyces cerevisiae for production of carboxylic acids: current status and challenges. FEMS Yeast Res. 9:1123-1136. - PubMed
-
- Babel, W., R. H. Muller, and K. D. Markuske. 1983. Improvement of growth yield of yeast on glucose to the maximum by using an additional energy source. Arch. Microbiol. 136:203-208.
-
- Bakker, B. M., K. M. Overkamp, A. J. van Maris, P. Kotter, M. A. Luttik, J. P. Van Dijken, and J. T. Pronk. 2001. Stoichiometry and compartmentation of NADH metabolism in Saccharomyces cerevisiae. FEMS Microbiol. Rev. 25:15-37. - PubMed
-
- Bruinenberg, P. M., R. Jonker, J. P. van Dijken, and W. A. Scheffers. 1985. Utilization of formate as an additional energy source by glucose-limited chemostat cultures of Candida utilis CBS 621 and Saccharomyces cerevisiae CBS 8066. Arch. Microbiol. 142:302-306.
-
- Bruinenberg, P. M., J. P. Van Dijken, and W. A. Scheffers. 1983. An enzymic analysis of NADPH production and consumption in Candida utilis. J. Gen. Microbiol. 129:965-971. - PubMed
Publication types
MeSH terms
Substances
LinkOut - more resources
Full Text Sources
Other Literature Sources
Molecular Biology Databases

