. 2010 Jan;137(1):83-91.
doi: 10.1242/dev.044149.

Dynamics of Delta/Notch signaling on endomesoderm segregation in the sea urchin embryo

Affiliations

Dynamics of Delta/Notch signaling on endomesoderm segregation in the sea urchin embryo

Jenifer C Croce et al. Development. 2010 Jan.

Abstract

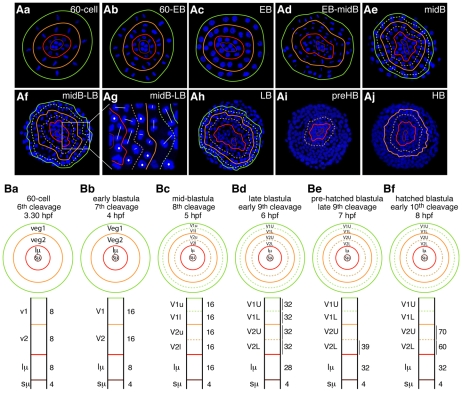
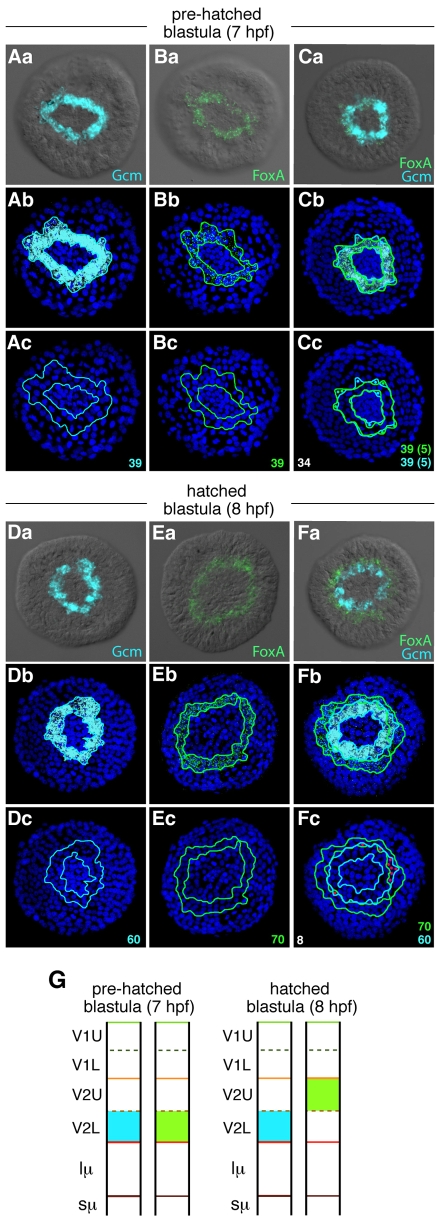
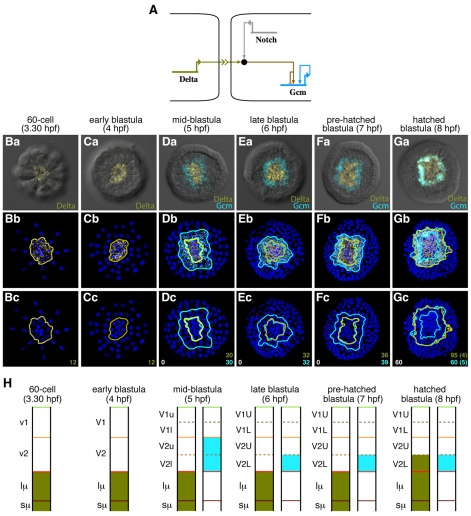
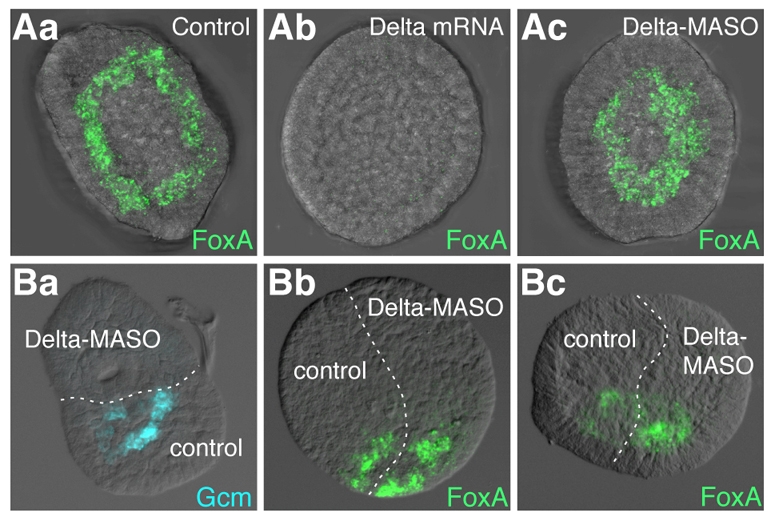
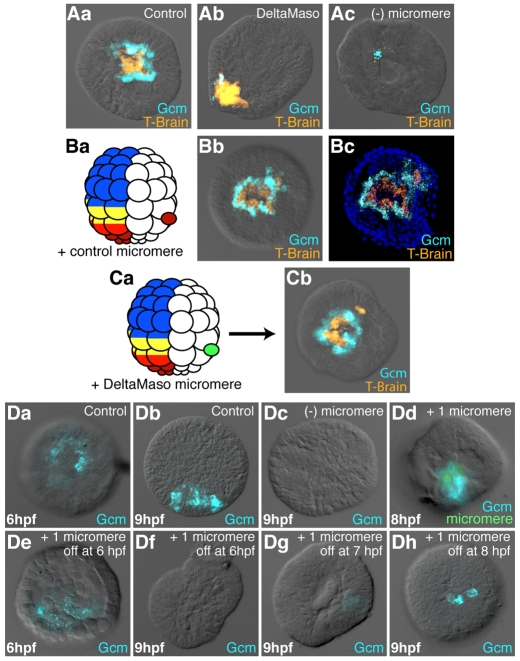
Endomesoderm is the common progenitor of endoderm and mesoderm early in the development of many animals. In the sea urchin embryo, the Delta/Notch pathway is necessary for the diversification of this tissue, as are two early transcription factors, Gcm and FoxA, which are expressed in mesoderm and endoderm, respectively. Here, we provide a detailed lineage analysis of the cleavages leading to endomesoderm segregation, and examine the expression patterns and the regulatory relationships of three known regulators of this cell fate dichotomy in the context of the lineages. We observed that endomesoderm segregation first occurs at hatched blastula stage. Prior to this stage, Gcm and FoxA are co-expressed in the same cells, whereas at hatching these genes are detected in two distinct cell populations. Gcm remains expressed in the most vegetal endomesoderm descendant cells, while FoxA is downregulated in those cells and activated in the above neighboring cells. Initially, Delta is expressed exclusively in the micromeres, where it is necessary for the most vegetal endomesoderm cell descendants to express Gcm and become mesoderm. Our experiments show a requirement for a continuous Delta input for more than two cleavages (or about 2.5 hours) before Gcm expression continues in those cells independently of further Delta input. Thus, this study provides new insights into the timing mechanisms and the molecular dynamics of endomesoderm segregation during sea urchin embryogenesis and into the mode of action of the Delta/Notch pathway in mediating mesoderm fate.


Figures

Fig. 1.
Fig. 1.
Cell lineage and cell fate of the vegetal plate of Lytechinus variegatus embryos from the 60-cell stage to the hatched blastula stage. (Aa-Aj) Single plane projections of confocal sections of vegetal plate embryos. Plain color-coded lines outline the repartition of each of the different cell sub-types that constitute the vegetal plate at the various developmental stages (small micromeres in brown, large micromeres in red, veg2 cells in orange, veg1 cells in green). The dotted colored lines indicate when a cell division occurred perpendicular to the animal-vegetal (AV) axis and created two cell layers of the same cell sub-type, e.g. veg2 layer in EB into Veg2U (Veg2 upper) and Veg2L (Veg2 lower). Nuclei are in blue. EB, early blastula stage; midB, mid-blastula stage; LB, late blastula stage; preHB, pre-hatched blastula stage; HB, hatched blastula stage. (Ba-Bf) Schematics of the distribution of the cell lineages that compose the vegetal plate through time. The circles reproduce schematically the information presented in B at the primary stages for this study. The rectangles provide the same information along the AV axis, with the vegetal pole at the bottom. Numbers on the right are the average number of cells counted for each cell layer, based on observations from this study. In both circles and rectangles, similar codes (color and plain or dotted lines) have been applied to those in A, and each cell layer was named according to its origin and cell division events.
Fig. 2.
Fig. 2.
FoxA-Gcm relationship on a cell-to-cell basis over time. (Aa-Fc) Single (A,B,D,E) and double (C,F) fluorescent in situ hybridization analyses of Gcm and FoxA expression at pre-hatched blastula stage (7 hpf; A-C) and hatched blastula stage (8 hpf; D-F). For both stages, the first row shows two-channel fluorescence and DIC images of FoxA (light green) and Gcm (blue) expression either individually (Aa,Ba,Da,Ea) or together (Ca,Fa). The second and third rows show confocal projections of the first row embryos with blue-labeled nuclei. On the third rows, only the outlines of the expression domains of FoxA and Gcm have been kept to determine the average number of cells (numbers in the right corner) expressing each gene (Ac,Bc,Dc,Ec) or both genes (Cc,Fc). In Cc, dots reflect cells that express either FoxA or Gcm (average numbers in parentheses). In Fc, red dots highlight cells that express both genes, on average eight cells. (G) Summary of FoxA (light green) and Gcm (blue) expression profiles throughout time and in regard to cell lineage.
Fig. 3.
Fig. 3.
Delta-Gcm relationship on a cellular basis prior to and at endomesoderm diversification. (A) Schematic of the known Delta/Notch signaling-Gcm regulatory relationship. Delta through its interaction with Notch activates Gcm in the neighboring cells. Gcm is able at some point to maintain its own expression by a positive feedback loop onto its own promoter. (Ba-Gc) Expression profiles of Delta (olive) and Gcm (blue) by double fluorescent in situ hybridization from the 60-cell to the hatched blastula stage. First row shows two fluorescence channels and DIC pictures of vegetally viewed embryos. Second and third rows show confocal images of first row embryos with the nuclei in blue. On the third row, only the outlines of the gene expression domains have been kept to determine the number of cells expressing each gene (numbers color-coded at the bottom right corner), on how many cell layers those cells are distributed (data reported in H), how many cells express both genes simultaneously (number in white in the bottom left corner), or solely one or the other gene (dots on Gc and numbers in parentheses). (H) Summary of Delta (olive) and Gcm (blue) expression patterns throughout time and with respect to cell lineage.
Fig. 4.
Fig. 4.
FoxA expression in Notch signaling perturbed embryos. (Aa-Ac) Effects of ectopic activation or repression of Delta/Notch signaling on FoxA expression. (Aa) control embryos, and embryos injected with (Ab) Delta mRNAs or (Ac) Delta-MASO. Embryos were fixed at the hatched blastula stage. (Ba-Bc) Delta-MASO/control chimera embryos generated at the 16-cell stage by the recombination of two AV half embryos; embryos were fixed at the hatched blastula stage. (Ba) Gcm (blue), (Bb,Bc) FoxA (green). All embryos are shown in vegetal view except for Bb and Bc, which are in lateral view.
Fig. 5.
Fig. 5.
Regulation of Gcm expression by the Delta/Notch signal. (Aa-Ac) Effects of the loss of the Delta signal on Gcm expression. Co-staining by double-fluorescent in situ hybridization for T-brain (a micromere progeny marker, orange) and Gcm (blue) on control embryos (Aa), Delta-MASO-injected embryos (Ab) and micromereless embryos (Ac). (Ba,Bb,Ca,Cb) Role of Delta in the loss of Gcm expression in the Veg2U cells. (Ba,Ca) Schematics of the experimental design. A control micromere (Ba) or a DeltaMaso-injected micromere (Ca) was transplanted in between the veg1 and veg2 cell layers of a control 60-cell stage embryo. Gcm, blue; Tbr, orange. At pre-hatched blastula stage, 22 out of the 25 embryos (88%) transplanted with a control micromere showed ectopic expression of Gcm (Bb), whereas none of the Delta-MASO-injected micromeres induced ectopic Gcm expression (Cb). Bb and Cb are two-channel fluorescence and DIC images; Bc is a confocal projection of Bb with nuclear staining in blue. (Da-Dh) Duration of the Delta signal is crucial for the maintenance of Gcm expression. (Da,Db) Control embryos at 6 and 9 hours post-fertilization (hfp). (Dc) Micromereless embryos at 9 hpf. (Dd,De) Embryos in which all micromeres have been replaced by a single green dyed micromere at the 16-cell stage. In Dd, the transplanted micromere has been maintained up to fixation, in De it has been removed just before fixation. In Df, Dg and Dh, the transplanted micromere was eliminated at 6, 7 or 8 hpf, respectively, and the embryos were fixed at 9 hpf. (A-D) All embryos are in vegetal view, except for Ab, Db, Dd and De, which are in lateral view.

References

    1. Bally-Cuif L., Goutel C., Wassef M., Wurst W., Rosa F. (2000). Coregulation of anterior and posterior mesendodermal development by a hairy-related transcriptional repressor. Genes Dev. 14, 1664-1677 - PMC - PubMed
    1. Cameron R. A., Fraser S. E., Britten R. J., Davidson E. H. (1991). Macromere cell fates during sea urchin development. Development 113, 1085-1091 - PubMed
    1. Croce J., Lhomond G., Gache C. (2003). Coquillette, a sea urchin T-box gene of the Tbx2 subfamily, is expressed asymmetrically along the oral-aboral axis of the embryo and is involved in skeletogenesis. Mech. Dev. 120, 561-572 - PubMed
    1. Davidson E. H., Rast J. P., Oliveri P., Ransick A., Calestani C., Yuh C. H., Minokawa T., Amore G., Hinman V., Arenas-Mena C., et al. (2002). A genomic regulatory network for development. Science 295, 1669-1678 - PubMed
    1. Ettensohn C. A., McClay D. R. (1988). Cell lineage conversion in the sea urchin embryo. Dev. Biol. 125, 396-409 - PubMed

Publication types

MeSH terms

LinkOut - more resources