. 2009 Dec;21(12):3868-84.
doi: 10.1105/tpc.109.068700. Epub 2009 Dec 18.

Arabidopsis formin3 directs the formation of actin cables and polarized growth in pollen tubes

Affiliations

Arabidopsis formin3 directs the formation of actin cables and polarized growth in pollen tubes

Jianrong Ye et al. Plant Cell. 2009 Dec.

Abstract

Cytoplasmic actin cables are the most prominent actin structures in plant cells, but the molecular mechanism underlying their formation is unknown. The function of these actin cables, which are proposed to modulate cytoplasmic streaming and intracellular movement of many organelles in plants, has not been studied by genetic means. Here, we show that Arabidopsis thaliana formin3 (AFH3) is an actin nucleation factor responsible for the formation of longitudinal actin cables in pollen tubes. The Arabidopsis AFH3 gene encodes a 785-amino acid polypeptide, which contains a formin homology 1 (FH1) and a FH2 domain. In vitro analysis revealed that the AFH3 FH1FH2 domains interact with the barbed end of actin filaments and have actin nucleation activity in the presence of G-actin or G actin-profilin. Overexpression of AFH3 in tobacco (Nicotiana tabacum) pollen tubes induced excessive actin cables, which extended into the tubes' apices. Specific downregulation of AFH3 eliminated actin cables in Arabidopsis pollen tubes and reduced the level of actin polymers in pollen grains. This led to the disruption of the reverse fountain streaming pattern in pollen tubes, confirming a role for actin cables in the regulation of cytoplasmic streaming. Furthermore, these tubes became wide and short and swelled at their tips, suggesting that actin cables may regulate growth polarity in pollen tubes. Thus, AFH3 regulates the formation of actin cables, which are important for cytoplasmic streaming and polarized growth in pollen tubes.


Figures

Figure 1.
Figure 1.
Recombinant AFH3 FH1FH2 Fusion Protein Nucleates Actin Assembly (A) Schematic representation of the predicted domain organization of AFH3. The full-length AFH3 contains 785 amino acids. The FH1 domain is from amino acids 253 to 307, and the FH2 domain is from amino acids 321 to 736. Recombinant AFH3 FH1FH2 and AFH3 FH2 fusion proteins include amino acids from 253 to 736 and 301 to 736, respectively. NΔFH1FH2 and ΔFH1FH2 are TAIR annotated full-length AFH3 and FH1FH2, respectively. SP, predicted signal peptide; TM, transmembrane domain; aa, amino acids. (B) Purification of AFH3 FH1FH2 and AFH3 FH2 fusion proteins. Coomassie blue–stained protein gel of recombinant formin proteins. Lane 1, GST-AFH3 FH1FH2 protein; lane 2, GST-AFH3 FH2 protein. (C) Time course of actin polymerization in the presence of AFH3 FH1FH2 monitored by pyrene fluorescence. Different concentrations of AFH3 FH1FH2 were added to 2.0 μM of 10% pyrene-labeled actin before initiation of actin polymerization. The concentration of AFH3 FH1FH2 from bottom to top is 0, 70, 90, 180, 250, 350, and 450 nM. (D) Nucleation efficiency of AFH3 FH1FH2. The efficiency of nucleation for AFH3 FH1FH2 was determined at half-maximal actin polymerization according to Blanchoin et al. (2000). (E) Time course of actin polymerization with 2.0 μM Arabidopsis profilin 4 in the presence or absence of AFH3 FH1FH2 monitored by pyrene fluorescence. Closed squares, 2.0 μM actin plus 2.0 μM Arabidopsis profilin 4; closed circles, 2.0 μM actin plus 2.0 μM Arabidopsis profilin 4 plus 500 nM AFH3 FH1FH2; closed triangles, 2.0 μM actin plus 2.0 μM Arabidopsis profilin 4 plus 1000 nM AFH3 FH1FH2. (F) and (G) Micrographs of actin filaments in the presence and absence of FH1FH2. (F) Actin alone; (G) actin plus 400 nM AFH3 FH1FH2. Bar in (F) = 10 μm. (H) Actin filaments mean length (±se). Actin alone, white bars; Actin plus 200 nM AFH1 FH1FH2, black bars; Actin plus 200 nM AFH3 FH1FH2, gray bars; Actin plus 400 nM AFH3 FH1FH2, hatched bars.
Figure 2.
Figure 2.
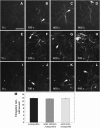
Direct Visualization of the Effect of AFH3 FH2 or AFH3 FH1FH2 on Actin Nucleation and Actin Filament Elongation by TIRFM. TIRFM was conducted with 1.5 μM ATP-Oregon-green-actin (33.3% labeled) incubated with 3 μM human profilin in the absence or presence of GST-AFH3 FH1FH2 or GST-AFH3 FH2. The time point of the captured image is indicated in seconds at the bottom, and white arrows indicate the elongating barbed end of the actin filament. Conditions: 10 mM imidazole, pH 7.0, 50 mM KCl, 1 mM MgCl2, 1 mM EGTA, 50 mM DTT, 0.2 mM ATP, 50 μM CaCl2, 15 mM glucose, 20 μg/mL catalase, 100 μg/mL glucose oxidase, 1.0% methylcellulose. Bar = 10 μm. (A) to (D) Time-lapse micrographs of profilin/Oregon-green-actin polymerization. NEM-myosin was added into a flow cell before the addition of 1.5 μM ATP-Oregon-green-actin (33.3% labeled) plus 3 μM human profilin. (E) to (H) Time-lapse micrographs of the effect of AFH3 FH1FH2 on actin polymerization. NEM-myosin and AFH3 FH1FH2 (200 nM) were attached before addition of 1.5 μM ATP-Oregon-green-actin (33.3% labeled) plus 3 μM human profilin. (I) to (L) Time-lapse micrographs of the effect of AFH3 FH1FH2 on actin polymerization. NEM-myosin and AFH3 FH2 (300 nM) were attached before addition of 1.5 μM ATP-Oregon-green-actin (33.3% labeled) plus 3 μM human profilin. (M) Plot of the elongation rates (±se) of actin filaments in the absence (black bar) or presence of AFH3 FH1FH2 (gray bar) or AFH3 FH2 (hatched bar).
Figure 3.
Figure 3.
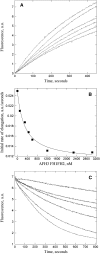
AFH3 FH1FH2 Binds to Barbed Ends and Blocks Actin Polymerization and Depolymerization from Barbed Ends. (A) Kinetics of actin filament barbed-end elongation in the presence of AFH3 FH1FH2. Preformed actin filaments (0.8 μM) were incubated with various concentrations of AFH3 FH1FH2 before the addition of 1 μM pyrene-actin monomers. The concentration of AFH3 FH1FH2 from top to the bottom: 0, 300, 450, 600, 1200, and 2000 nM. (B) Variation in the initial rate of elongation as a function of AFH3 FH1FH2 concentration. The data were fit with Equation 1 (see Methods) to determine the equilibrium dissociation constant value of 307 nM for AFH3 FH1FH2. (C) Kinetics of actin depolymerization in the presence of various concentrations of AFH3 FH1FH2. AFH3 FH1FH2 was incubated with 5 μM F-actin for 5 min before dilution of the solution 25-fold into Buffer G. The concentration of AFH3 FH1FH2 from bottom to top: 0, 50, 70, 150, 200, and 400 nM.
Figure 4.
Figure 4.
AFH3 FH1FH2 Inhibits Reannealing of Actin Filaments. (A) to (I) Four micromolar polymerized actin was stabilized with 4 μM rhodamine-phalloidin, sheared by a needle, and then allowed to reanneal in the presence of buffer, 300 nM AFH1 FH1FH2, or 300 nM AFH3 FH1FH2. Samples were diluted at the indicated time points and visualized by fluorescence microscopy. Bar in (A) = 10 μm and applies to (A) to (I). (J) Mean length of actin filaments (±se) at different time points. Actin alone, black bars; Actin plus AFH1 FH1FH2, white bars; Actin plus AFH3 FH1FH2, crosshatched bars.
Figure 5.
Figure 5.
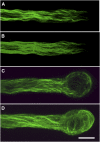
Overexpression of AFH3-NΔFH1FH2 Induces the Formation of Excessive Actin Cables in Tobacco Pollen Tubes and Causes Swollen Pollen Tubes to Swell. (A) and (B) A control pollen tube transformed with Lat52:GFP-fABD2 (1 μg), showing the actin cytoskeleton at the medial section of the pollen tube (A) and a projection of the whole pollen tube (B). (C) and (D) A typical pollen tube cotransformed with Lat52:GFP-fABD2 (1 μg) and Lat52:NΔFH1FH2 (3 μg). A medial section of the pollen tube (C) and a projection of the whole pollen tube (D). Bar = 5 μm.
Figure 6.
Figure 6.
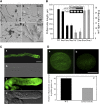
Downregulation of AFH3 Expression Induces the Loss of Actin Cables in the Shank of the Pollen Tube and Consequently Inhibits Its Growth and Increases Its Width. (A) Pollen tube phenotype typical of those from wild-type plants and different AFH3-RNAi lines after culturing in germination medium for 3 h; (a) wild type; (b) RNAi line 1; (c) RNAi line 2; (d) RNAi line 3. Bar = 100 μm for (a) to (d). (B) Quantitative analysis of the effect of AFH3 knockdown on pollen tube length and width. Inset: RT-PCR analysis confirms the knockdown of AFH3 transcript in different AFH3 RNAi lines. (C) Visualization of the actin cytoskeleton in pollen tubes stained with by Alexa-488 phalloindin. The actin cytoskeleton of a wild-type pollen tube (a) and AFH3 RNAi pollen tube (c) was visualized by confocal laser scanning microscopy after staining with Alexa-488-phalloidin. (b) and (d) show the corresponding bright-field images for (a) and (c) pollen tubes, respectively. Bar = 10 μm in (a) to (d). (D) The filamentous actin level was substantially decreased in the pollen grains of the AFH3 RNAi transgenic plant. The actin cytoskeleton of a pollen grain from wild-type (a) and AFH3 RNAi (b) plants was visualized by confocal laser scanning microscopy after staining with Alexa-488-phalloidin. Confocal settings and image collection and display parameters were identical between pollen grains. Images shown are z-series stacks of all optical sections. Bar = 10 μm. In (c), the average pixel intensity was measured for the pollen grains by confocal laser scanning microscopy. About 100 pollen grains were measured for each genotype, and the mean values (±se) are plotted.
Figure 7.
Figure 7.
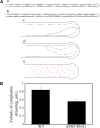
Cytoplasmic Streaming Direction Was Altered and the Velocity of Cytoplasmic Streaming Was Reduced in AFH3 RNAi Pollen Tubes. (A) Schematic representation of the cytoplasmic streaming pattern in wild-type ([a] and [b]) and AFH3 RNAi ([c] to [e]) pollen tubes. Red arrows represent the direction of cytoplasmic streaming that moves particles toward the tip of the pollen tube; green arrows represent the direction of cytoplasmic streaming that moves particles backward in the pollen tube; the black lines in the pollen tube indicate the cytoplasmic streaming track. (B) The velocity of cytoplasmic streaming was analyzed by Image J software (http://rsbweb.nih.gov/ij/). Twenty cytoplasmic streaming particles from several independent pollen tubes were measured for each genotype. and the mean values (±se) are plotted.

Similar articles

Cited by

References

    1. Amann, K.J., and Pollard, T.D. (2001). Direct real-time observation of actin filament branching mediated by Arp2/3 complex using total internal reflection fluorescence microscopy. Proc. Natl. Acad. Sci. USA 98 15009–15013. - PMC - PubMed
    1. Banno, H., and Chua, N.H. (2000). Characterization of the arabidopsis formin-like protein AFH1 and its interacting protein. Plant Cell Physiol. 41 617–626. - PubMed
    1. Bechtold, N., and Pelletier, G. (1998). In planta Agrobacterium-mediated transformation of adult Arabidopsis thaliana plants by vacuum infiltration. Methods Mol. Biol. 82 259–266. - PubMed
    1. Blanchoin, L., Amann, K.J., Higgs, H.N., Marchand, J.B., Kaiser, D.A., and Pollard, T.D. (2000). Direct observation of dendritic actin filament networks nucleated by Arp2/3 complex and WASP/Scar proteins. Nature 404 1007–1011. - PubMed
    1. Blanchoin, L., and Staiger, C.J. (2008). Plant formins: Diverse isoforms and unique molecular mechanism. Biochim. Biophys. Acta doi:10.1016/j.bbamcr.2008.09.015. - PubMed

Publication types

MeSH terms