. 2010 Nov;43(5):591-8.
doi: 10.1165/rcmb.2006-0381OC. Epub 2009 Dec 18.

Effect of neutrophil adhesion on the mechanical properties of lung microvascular endothelial cells

Affiliations

Effect of neutrophil adhesion on the mechanical properties of lung microvascular endothelial cells

Inkyung Kang et al. Am J Respir Cell Mol Biol. 2010 Nov.

Abstract

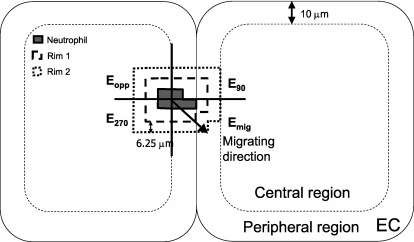
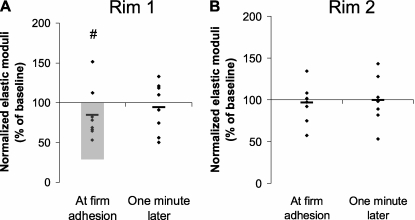
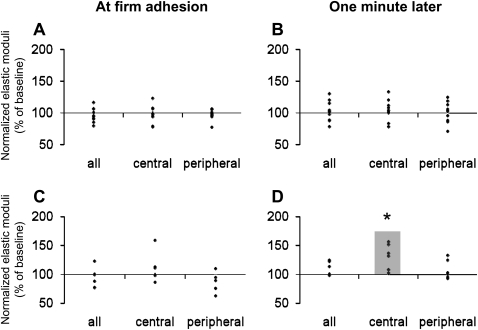
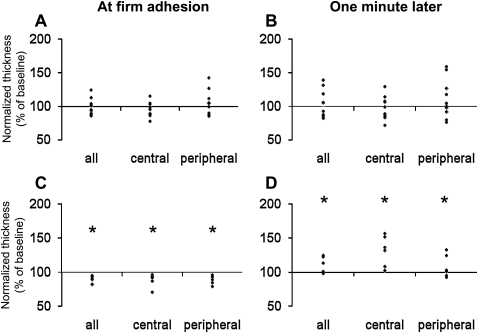
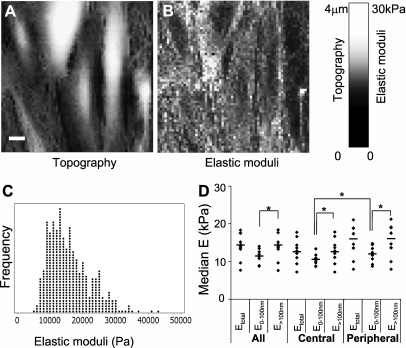
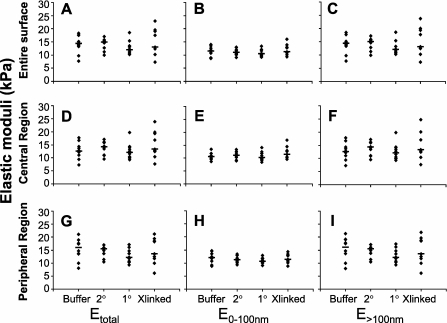
Neutrophil adhesion to pulmonary microvascular endothelial cells (ECs) initiates intracellular signaling, resulting in remodeling of F-actin cytoskeletal structure of ECs. The present study determined the mechanical properties of ECs and the changes induced by neutrophil adhesion by atomic force microscopy. The elastic moduli of ECs were compared before neutrophils were present, as soon as neutrophil adhesion was detected, and 1 minute later. ECs that were adjacent to those with adherent neutrophils were also evaluated. Neutrophil adhesion induced a decrease in the elastic moduli in the 6.25-μm rim of ECs surrounding adherent neutrophils as soon as firmly adherent neutrophils were detected, which was transient and lasted less than 1 minute. Adjacent ECs developed an increase in stiffness that was significant in the central regions of these cells. Intercellular adhesion molecule-1 crosslinking did not induce significant changes in the elastic modulus of ECs in either region, suggesting that crosslinking intercellular adhesion molecule-1 is not sufficient to induce the observed changes. Our results demonstrate that neutrophil adhesion induces regional changes in the stiffness of ECs.


Figures

Figure 1.
Figure 1.
Force-displacement curves obtained during a single indentation with atomic force microscopy (AFM). (A) The contact point (+) between the AFM probe and the endothelial cell (EC) was identified in the force-displacement curve as the point where the difference between the force-displacement curve and a straight line drawn from a point offset from the starting point by 500 nm on the x-axis (x0−500, y0) and the last point of the curve is maximal. The shaded rectangle denotes the in-contact region where the AFM probe was applying force to the cells. (B) Apparent elastic moduli were determined by optimization of the elastic modulus parameter in the force-displacement equation given by Hertz's and Sneddon's infinitesimal strain theory. The value of E that provided a positive correlation (R2 > 0) between the data and the theoretical model was considered the elastic modulus for that pixel. The elastic moduli were determined in different ranges of indentation depths: E0–100 nm for the indentation depth 0–100 nm; E>100 nm for the indentation depth greater than 100 nm; and Etotal for the entire indentation depth.
Figure 2.
Figure 2.
Apparent elastic moduli of ECs during neutrophil adhesion and migration were determined in central and peripheral regions of ECs, as well as in quadrants around adherent neutrophils. The elastic moduli were determined in the peripheral regions within 10 μm of EC borders and in the central regions excluding the area near the nucleus. The elastic moduli were also determined in the EC regions immediately surrounding the adherent neutrophils. Rim 1 consisted of the first pixels around neutrophils (within 0–6.25 μm from the adherent neutrophils). Rim 2 consisted of the second pixels around neutrophils (from 6.25 to 12.50 μm). The rims around neutrophils were divided into four subregions according to the direction of neutrophil migration, and the elastic moduli of each subregion were determined in the migrating direction (Emig), in the opposite direction (Eopp), and perpendicular to the axis of migrating direction (E90, E270).
Figure 3.
Figure 3.
Changes in the Etotal of the EC regions surrounding adherent neutrophils. The changes were determined by comparing the elastic moduli of rim 1 and rim 2 around adherent neutrophils compared with the baseline values (please see Figure 2 for definition of these regions). (A) The stiffness in rim 1 significantly decreased at firm adhesion (shaded area in A; #P < 0.05 in Wilcoxon's matched-pair test). This change was transient, and was not observed 1 minute later. (B) No change was observed in rim 2.
Figure 4.
Figure 4.
Changes in the Etotal of EC regions soon after neutrophil adhesion and 1 minute later. The changes were assessed by comparing the values of elastic moduli and the thickness after neutrophil adhesion compared with the baseline values before adding neutrophils; the difference was regarded as significant if P was less than 0.05 in Wilcoxon's matched-pair test or in sign test. The elastic moduli after neutrophil adhesion were normalized as a percentage of the baseline values in the same region before adding neutrophils. (A and B) ECs to which neutrophils were adherent. Neutrophil adhesion induced no significant changes in the Etotal in either the central or the peripheral regions of the ECs at the time that firm adhesion was first detected (A) or 1 minute later (B). All neutrophils (n = 8) were located at the peripheral regions of ECs at firm adhesion (n = 10 ECs from 7 monolayers). (C and D) ECs adjacent to the ECs on which neutrophils were adherent. Adjacent ECs showed no change in Etotal at the time when firm adhesion was identified (C). However, within 1 minute, neutrophil adhesion induced an increase in stiffness that was significant in the central regions of the adjacent ECs (D) (n = 6 ECs). *P < 0.05 by the sign test and Wilcoxon's matched-pair test when the raw values were compared.
Figure 5.
Figure 5.
Changes in the thickness of EC regions soon after neutrophil adhesion and 1 minute later compared with their thickness before neutrophil adhesion. (A and B) ECs to which neutrophils were adherent. Neutrophil adhesion induced no significant changes in the thickness of any EC region at the time when firm adhesion was first detected (A) or 1 minute later (B) (n = 10 ECs from 7 monolayers). (C and D) ECs adjacent to the ECs on which neutrophils were adherent. Adjacent ECs showed a significant decrease in thickness at the time when firm adhesion was identified (C). Within 1 minute, the thickness of these adjacent ECs had increased to values above the baseline value before neutrophil adhesion (D) (n = 6 ECs). *P < 0.05 by the sign test and Wilcoxon matched-pair test.
Figure 6.
Figure 6.
Representative topographic image (A), map of elastic moduli (B), dot plot of elastic properties over the entire surface of a TNF-α–treated EC (C), and median Etotal, E0–100 nm, and E>100 nm of TNF-α–treated ECs (D). (A and B) In the topographic image and map of elastic moduli, the Z height and elastic modulus of each pixel is represented as the brightness of that pixel in respective images, as shown in the scale bar on the right. The scale bar in the topographic image represents 10 μm. (C) The dot plot of all elastic moduli values of a single TNF-α–treated EC shows that these moduli are not normally distributed, but are right-skewed. (D) The median Etotal, E0–100 nm, and E>100 nm of the entire surface and of the central and peripheral regions of TNF-α–treated ECs were compared. E>100 nm was significantly greater than E0–100 nm in both the central and the peripheral regions (*P < 0.05 in sign test and Wilcoxon's matched-pair test). E0–100 nm of the peripheral regions were significantly greater than those of the central regions (*P < 0.05 in sign test and Wilcoxon's matched-pair test).
Figure 7.
Figure 7.
Elastic moduli of ECs before and after intercellular adhesion molecule (ICAM)–1 crosslinking. The median Etotal (A), E0–100 nm (B), and E>100 nm (C) were determined over the entire surface of each EC for ICAM-1 crosslinked ECs (Xlinked), and for control groups treated with buffer only, secondary antibodies only, or primary antibodies only (Buffer, 2°, and 1°, respectively). Similarly, the median Etotal, E0–100 nm, and E>100 nm of ICAM-1 crosslinked ECs and control groups were determined in the central (DF) and peripheral (GI) regions for each EC. No significant difference was found between the ICAM-1 crosslinked ECs and the three control groups in any indentation depth or any region (n = 10, 10, 10, and 9 ECs from 3 monolayers for Buffer, 2°, 1°, and Xlinked groups, respectively).

Similar articles

Cited by

References

    1. Wang Q, Chiang ET, Lim M, Lai J, Rogers R, Janmey PA, Shepro D, Doerschuk CM. Changes in the biomechanical properties of neutrophils and endothelial cells during adhesion. Blood 2001;97:660–668. - PubMed
    1. Wang Q, Doerschuk CM. Neutrophil-induced changes in the biomechanical properties of endothelial cells: roles of ICAM-1 and reactive oxygen species. J Immunol 2000;164:6487–6494. - PubMed
    1. Wang Q, Yerukhimovich M, Gaarde WA, Popoff IJ, Doerschuk CM. Mkk3 and -6–dependent activation of p38alpha MAP kinase is required for cytoskeletal changes in pulmonary microvascular endothelial cells induced by ICAM-1 ligation. Am J Physiol Lung Cell Mol Physiol 2005;288:L359–L369. - PubMed
    1. Marchant RE, Kang I, Sit PS, Zhou Y, Todd BA, Eppell SJ, Lee I. Molecular views and measurements of hemostatic processes using atomic force microscopy. Curr Protein Pept Sci 2002;3:249–274. - PubMed
    1. Radmacher M. Measuring the elastic properties of living cells by the atomic force microscope. Methods Cell Biol 2002;68:67–90. - PubMed

Publication types

MeSH terms

Substances