. 2010 Feb 25;115(8):1572-81.
doi: 10.1182/blood-2009-08-237917. Epub 2009 Dec 18.

Distinct roles for LFA-1 affinity regulation during T-cell adhesion, diapedesis, and interstitial migration in lymph nodes

Affiliations

Distinct roles for LFA-1 affinity regulation during T-cell adhesion, diapedesis, and interstitial migration in lymph nodes

Eun Jeong Park et al. Blood. .

Abstract

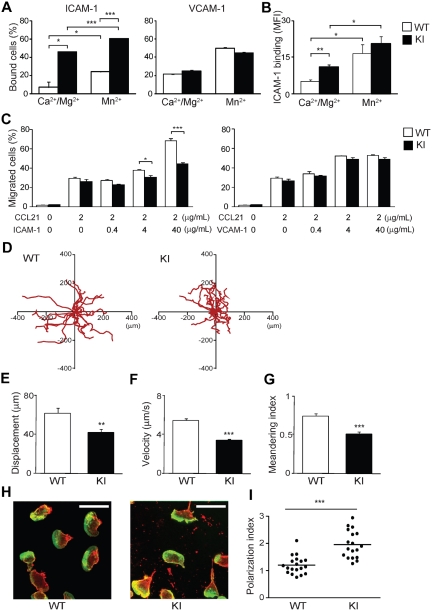
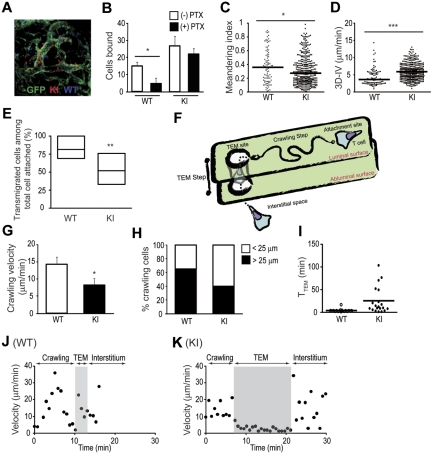
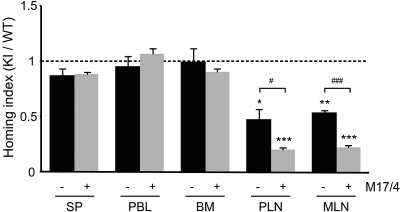
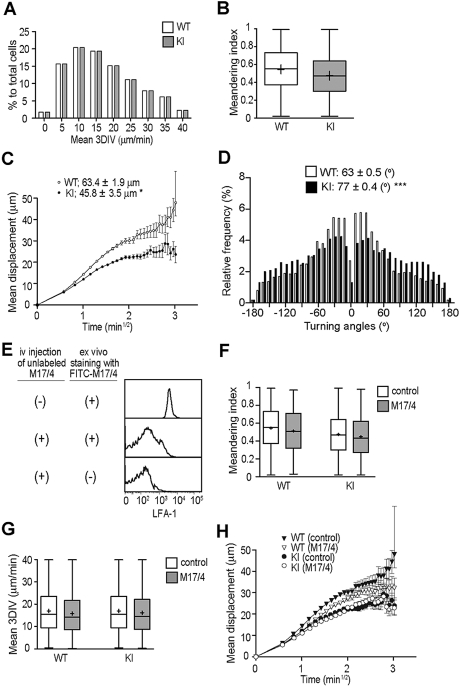
During the course of homing to lymph nodes (LNs), T cells undergo a multistep adhesion cascade that culminates in a lymphocyte function-associated antigen 1 (LFA-1)-dependent firm adhesion to the luminal surface of high endothelial venules (HEVs). The importance of LFA-1 affinity regulation in supporting T-cell arrest on HEVs has been well established, however, its importance in the postadhesion phase, which involves intraluminal crawling and diapedesis to the extravascular space, remains elusive. Here we have shown that LFA-1 affinity needs to be appropriately regulated to support these essential steps in the homing cascade. Genetically engineered T cells that were unable to properly down-regulate LFA-1 affinity underwent enhanced, chemokine-independent arrest in HEVs but showed perturbed intravascular crawling to transmigration sites and compromised diapedesis across HEVs. By contrast, the extravascular migration of T cells was insensitive to the affinity-enhancing LFA-1 mutation. These results highlight the requirement for balanced LFA-1 affinity regulation in intravascular and transvascular, but not extravascular, T-cell migration in LNs.


Figures

Figure 1
Figure 1
Generation of αL-I306A mice. (A) Structure of the mouse αL I domain built by homology modeling using a crystal structure of the human αL I domain (1ZON) as a template. The Mg2+ ion at the ligand binding site (ie, metal ion–dependent adhesion site) is shown with a green sphere and the side chain of I306 is in red. The amino (N) and the carboxyl (C) termini are labeled. Note that I306 is located in the hydrophobic pocket underneath the C-terminal helix. (B) Targeted insertion to the Itgal locus of the floxed ACN cassette and the mutated exon 9 (9*) that contains αL-I306A. The (1) targeting vector, (2) wild-type Itgal locus, (3) targeted Itgal allele containing floxed ACN cassette, and (4) mutated Itgal (I306A) allele are shown. Exons are shown as filled boxes. Long arm (LA) and short arm (SA) of homology, as well as the diphtheria toxin (DT) are shown. The floxed ACN cassette is deleted in chimeric male mice during spermatogenesis, leaving one loxP site (4). An engineered EcoRI site (E*) was designed to identify the targeted allele by Southern blot analysis. N indicates NcoI; E, EcoRI; A, AvrII; Sm, SmaI; and S, SpeI. The thick black line indicates the probe used to screen for homologous recombinations. (C) Genotyping and confirmation of deleted ACN cassette by polymerase chain reaction (PCR). Genomic DNA isolated from tails was used for PCR analyses. PCR bands are shown for wild-type (WT/WT, 300 bp), heterozygote (KI/WT, 300 and 390 bp), and homozygote (KI/KI, 390 bp) samples.
Figure 2
Figure 2
Adhesive interactions of WT and αL-I306A (KI) cells with ICAM-1 in vitro. (A) Cell adhesion of splenocytes to ICAM-1 and VCAM-1 substrates studied using a V-bottom-well plate. Cell suspensions were added to the plates and immediately centrifuged at 200g for 15 minutes to remove unbound cells. (B) Binding of soluble ICAM-1–Fc to WT and KI splenocytes. Bound ICAM-1–Fc was detected with indirect immunofluorescent cytometry using fluorescein isothiocyanate (FITC) anti–human immunoglobulin G (Fc-specific) antibody. (C) Transmigration of WT and KI splenocytes toward a CCL21 gradient through mock-, ICAM-1–coated, and VCAM-1–coated permeable inserts was examined using a modified Boyden chamber assay with a Transwell system (Corning Inc). (A-C) Data are expressed as the mean ± SEM of triplicates from 4 independent experiments. (D-I) 2D migration of T lymphocytes on ICAM-1. (D) 2D tracking of WT and αL-I306A (KI) TCM migrating ICAM-1/CXCL12 substrates. Each track (red) represents migratory paths of individual WT (n = 20) and KI (n = 20) over a 25-minute period. Mean displacement (E), mean velocity (F), and meandering index (G) of laterally migrating TCMs on ICAM-1/CXCL12 substrates were obtained from analysis of live-cell imaging. (E-G) Data are expressed as mean values ± SEM. (H) Representative confocal images of T lymphocytes migrating on ICAM-1/CXCL12 stained for actin (Alexa 488) and αL integrin (cyanin 3) are shown. White bars represent 10 μm. Confocal imaging was performed with a Radiance 2000 Laser-scanning confocal system (Bio-Rad Laboratories) using an Olympus BX50BWI microscope outfitted with a 100×/1.0 numeric aperture water-immersion objective coupled to a photomultiplier tube (PMT) detection system. Imaging medium was PBS. Images were acquired with BioRad2000 Version 2 software and subsequently processed with OpenLab Version 3.0 software. (I) The polarization index of T cells from randomly selected fields. Thick horizontal bars indicate mean values. (A-C,E-F,I) Data are expressed as the mean values ± SEM. Two-tailed Student t test was used for statistical analyses. Statistical significance was defined as *P < .05, **P < .01, or ***P < .001.
Figure 3
Figure 3
In vivo homing of T lymphocytes. Equal numbers of differentially labeled cells were mixed and injected into C57BL/6J-CD45.1+ congenic recipient mice. The number of homed donor cells and homing indices were determined 2 hours after injection. Data are expressed as the mean values ± SEM. Two-tailed Student t test was used for statistical analyses. Statistical significance was defined as *P < .05, **P < .01, or ***P < .001 vs SP. SP indicates spleen; PBL, peripheral blood lymphocytes; PLN, peripheral lymph node; MLN, mesenteric lymph node; PP, Peyer patch; SI, small intestine; LI, large intestine; BM, bone marrow; LIV, liver; and LUN, lung.
Figure 4
Figure 4
Adhesive interactions of T cells with lymph node vessels studied by epifluorescent IVM on inguinal LNs. (A-B) Rolling fractions. WT and αL-I306A T cells showed comparable rolling fractions in the absence (A) or presence (B) of LFA1 blocking antibody M17/4. (C) Rolling velocity on high-order venules. αL-I306A T cells rolled slower on high-order LN venules than WT. After LFA-1 blockade by M17/4 antibody, both cell types showed comparable rolling velocity. (D) Sticking fractions of WT and KI cells. The fraction of sticking cells was increased for αL-I306A T exclusively on IV and V order venules. Data are expressed as the mean ± SEM of 3 independent experiments. Two-tailed Student t test was used for statistical analyses. Statistical significance was defined as *P < .05 or ***P < .001.
Figure 5
Figure 5
MP-IVM investigations on T-cell interactions with HEVs. (A) A representative image of adoptively transferred WT T cells (blue) and αL-I306A T cells (red) interacting with popliteal lymph node vessels (green) of GFP-chimeric recipient mice. (B) Gαi-independent arresting of KI cells. Firm adhesion of αL-I306A T cells to HEV endothelial cells was independent of Gαi signals, whereas WT T-cell adhesion was reduced by pertussis toxin (PTX) treatment. (C-D) Motility parameters of T cells in the LN vessel compartment. Meandering index (C) and 3D-IV (D) are shown. (E) Overall transendothelial migration efficacy of arrested cells. Each migratory path of arrested WT and KI T cell on HEVs was traced and analyzed. The line in the box-plot indicates the median, the box-part represents the interquartile range, the whiskers depict the 5th and 95th percentiles, and the crosses represent the mean of 3 independent experiments. (F) A graphic representation of the crawling and TEM steps during adhesive interactions of T cells with HEVs. (G-H) Velocity (G) and traveling distance (H) during the crawling step. αL-I306A T cells migrated slower and a shorter distance on HEVs than did WT T cells. (I) Time required for completing the TEM step. (J-K) Representative migration velocity profiles of WT (J) and KI (K) T cells during the crawling and TEM steps. (B-D,G) Data are expressed as the mean values ± SEM of 3 independent experiments. Two-tailed Student t test was used for statistical analyses. Statistical significance was defined as *P < .05 or ***P < .001. (C-D,H-I) A representative result from 3 independent experiments is shown. (C-D,I) Thick horizontal bars indicate mean values.
Figure 6
Figure 6
Impact of the delayed LFA-1 inhibition on in vivo T-cell homing. Equal numbers of fluorescently labeled WT and KI T cells were mixed and intravenously injected into C57BL/6J-CD45.1+ congenic mice. One hour after cell injection, the mice were injected intravenously with vehicle or 100 μg of anti–LFA-1 mAb M17/4. One hour later, selected organs were harvested and the homing index (KI/WT) was determined. Homing index in LNs was compared with and without delayed M17/4 treatment. Data are expressed as the mean values ± SEM of at least 4 independent experiments. Two-tailed Student t test was used for statistical analyses. Statistical significance was defined as *P < .05, **P < .01, or ***P < .001 vs SP. (#P < .05 or ###P < .001 in groups with and without mAb [M17/4] treatment.) SP indicates spleen; PBL, peripheral blood lymphocytes; BM, bone marrow; PLN, peripheral lymph node; and MLN, mesenteric lymph node.
Figure 7
Figure 7
MP-IVM investigations on T-cell interstitial motilities. Motility parameters were measured 18 to 24 hours after adoptive transfer of WT and αL-I306A T cells in C57BL/6 mice. (A) Mean 3D instantaneous velocity (3D-IV). (B) Meandering index. (C) Motility coefficient. (D) Tuning angles. (E) FACS histograms showing a staining of PLN T cells with FITC-labeled anti–LFA-1 mAb M17/4. T cells were isolated from either mice that had been administered with unlabeled M17/4 (middle panel) or those that had been mock treated (top panel). Please note that prior in vivo administration of unlabeled M17/4 competed for LFA-1 with FITC-M17/4. (F-G) Motility parameters after LFA-1 inhibition with M17/4. M17/4 treatment affected neither meandering index (F), mean 3DIV (G), nor motility coefficient (H) of WT and KI cells. (A-H) A representative result from 3 independent experiments is shown. (C,H) Data are expressed as the mean values ± SEM. Data are expressed as mean values ± SEM (B,F-G). The line in the box-plot indicates the mean values, and the top and the bottom of the box represent the maximum and minimum values, respectively. The data are from 3 independent experiments. Two-tailed Student t test was used for statistical analyses. Statistical significance was defined as *P < .05 or ***P < .001.

References

    1. von Andrian UH, Mackay CR. T-cell function and migration: two sides of the same coin. N Engl J Med. 2000;343(14):1020–1034. - PubMed
    1. Mempel TR, Scimone ML, Mora JR, von Andrian UH. In vivo imaging of leukocyte trafficking in blood vessels and tissues. Curr Opin Immunol. 2004;16(4):406–417. - PubMed
    1. Ley K, Laudanna C, Cybulsky MI, Nourshargh S. Getting to the site of inflammation: the leukocyte adhesion cascade updated. Nat Rev Immunol. 2007;7(9):678–689. - PubMed
    1. Alon R, Ley K. Cells on the run: shear-regulated integrin activation in leukocyte rolling and arrest on endothelial cells. Curr Opin Cell Biol. 2008;20(5):525–532. - PMC - PubMed
    1. Shulman Z, Shinder V, Klein E, et al. Lymphocyte crawling and transendothelial migration require chemokine triggering of high-affinity LFA-1 integrin. Immunity. 2009;30(3):384–396. - PMC - PubMed

Publication types

MeSH terms

Substances