

Modifications of protein environment of the [2Fe-2S] cluster of the bc1 complex: effects on the biophysical properties of the rieske iron-sulfur protein and on the kinetics of the complex
- PMID: 20023300
- PMCID: PMC2838342
- DOI: 10.1074/jbc.M109.043505
Modifications of protein environment of the [2Fe-2S] cluster of the bc1 complex: effects on the biophysical properties of the rieske iron-sulfur protein and on the kinetics of the complex
Abstract
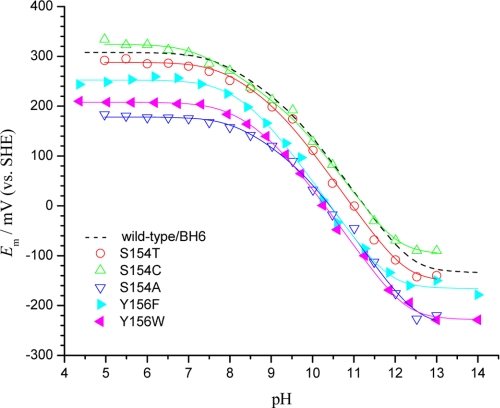
The rate-determining step in the overall turnover of the bc(1) complex is electron transfer from ubiquinol to the Rieske iron-sulfur protein (ISP) at the Q(o)-site. Structures of the ISP from Rhodobacter sphaeroides show that serine 154 and tyrosine 156 form H-bonds to S-1 of the [2Fe-2S] cluster and to the sulfur atom of the cysteine liganding Fe-1 of the cluster, respectively. These are responsible in part for the high potential (E(m)(,7) approximately 300 mV) and low pK(a) (7.6) of the ISP, which determine the overall reaction rate of the bc(1) complex. We have made site-directed mutations at these residues, measured thermodynamic properties using protein film voltammetry to evaluate the E(m) and pK(a) values of ISPs, explored the local proton environment through two-dimensional electron spin echo envelope modulation, and characterized function in strains S154T, S154C, S154A, Y156F, and Y156W. Alterations in reaction rate were investigated under conditions in which concentration of one substrate (ubiquinol or ISP(ox)) was saturating and the other was varied, allowing calculation of kinetic terms and relative affinities. These studies confirm that H-bonds to the cluster or its ligands are important determinants of the electrochemical characteristics of the ISP, likely through electron affinity of the interacting atom and the geometry of the H-bonding neighborhood. The calculated parameters were used in a detailed Marcus-Brønsted analysis of the dependence of rate on driving force and pH. The proton-first-then-electron model proposed accounts naturally for the effects of mutation on the overall reaction.
Figures


Similar articles
-
Modulation of the midpoint potential of the [2Fe-2S] Rieske iron sulfur center by Qo occupants in the bc1 complex.Biochemistry. 2002 Dec 3;41(48):14372-82. doi: 10.1021/bi026198c. Biochemistry. 2002. PMID: 12450404
-
The iron-sulfur cluster of the Rieske iron-sulfur protein functions as a proton-exiting gate in the cytochrome bc(1) complex.J Biol Chem. 2005 Jul 1;280(26):24895-902. doi: 10.1074/jbc.M503319200. Epub 2005 May 4. J Biol Chem. 2005. PMID: 15878858
-
Proton-coupled electron transfer at the Qo-site of the bc1 complex controls the rate of ubihydroquinone oxidation.Biochim Biophys Acta. 2004 Apr 12;1655(1-3):77-92. doi: 10.1016/j.bbabio.2003.10.012. Biochim Biophys Acta. 2004. PMID: 15100020 Review.
-
Elimination of the disulfide bridge in the Rieske iron-sulfur protein allows assembly of the [2Fe-2S] cluster into the Rieske protein but damages the ubiquinol oxidation site in the cytochrome bc1 complex.Biochemistry. 2003 Nov 25;42(46):13637-45. doi: 10.1021/bi035344r. Biochemistry. 2003. PMID: 14622010
-
Design and use of photoactive ruthenium complexes to study electron transfer within cytochrome bc1 and from cytochrome bc1 to cytochrome c.Biochim Biophys Acta. 2013 Nov-Dec;1827(11-12):1309-19. doi: 10.1016/j.bbabio.2012.09.002. Epub 2012 Sep 15. Biochim Biophys Acta. 2013. PMID: 22985600 Free PMC article. Review.
Cited by
-
The mechanism of ubihydroquinone oxidation at the Qo-site of the cytochrome bc1 complex.Biochim Biophys Acta. 2013 Nov-Dec;1827(11-12):1362-77. doi: 10.1016/j.bbabio.2013.01.009. Epub 2013 Feb 8. Biochim Biophys Acta. 2013. PMID: 23396004 Free PMC article. Review.
-
The respiratory arsenite oxidase: structure and the role of residues surrounding the rieske cluster.PLoS One. 2013 Aug 30;8(8):e72535. doi: 10.1371/journal.pone.0072535. eCollection 2013. PLoS One. 2013. PMID: 24023621 Free PMC article.
-
Quinol oxidase encoded by cyoABCD in Rhizobium etli CFN42 is regulated by ActSR and is crucial for growth at low pH or low iron conditions.Microbiology (Reading). 2015 Sep;161(9):1806-1815. doi: 10.1099/mic.0.000130. Epub 2015 Jul 9. Microbiology (Reading). 2015. PMID: 26297648 Free PMC article.
-
Identification of ubiquinol binding motifs at the Qo-site of the cytochrome bc1 complex.J Phys Chem B. 2015 Jan 15;119(2):433-47. doi: 10.1021/jp510022w. Epub 2014 Nov 24. J Phys Chem B. 2015. PMID: 25372183 Free PMC article.
-
Communication: Microsecond dynamics of the protein and water affect electron transfer in a bacterial bc(1) complex.J Chem Phys. 2015 Apr 28;142(16):161101. doi: 10.1063/1.4919222. J Chem Phys. 2015. PMID: 25933744 Free PMC article.
References
-
- Mitchell P. (1976) J. Theor. Biol. 62, 327–367 - PubMed
-
- Crofts A. R. (2004) Photosynth. Res. 80, 223–243 - PubMed
-
- Xia D., Yu C. A., Kim H., Xia J. Z., Kachurin A. M., Zhang L., Yu L., Deisenhofer J. (1997) Science 277, 60–66 - PubMed
-
- Zhang Z., Huang L., Shulmeister V. M., Chi Y. I., Kim K. K., Hung L. W., Crofts A. R., Berry E. A., Kim S. H. (1998) Nature 392, 677–684 - PubMed
-
- Iwata S., Lee J. W., Okada K., Lee J. K., Iwata M., Rasmussen B., Link T. A., Ramaswamy S., Jap B. K. (1998) Science 281, 64–71 - PubMed
Publication types
MeSH terms
Substances
Grants and funding
LinkOut - more resources
Full Text Sources
