. 2010 Aug;34(2):150-61.
doi: 10.1097/SHK.0b013e3181cf70fb.

Deficiency of Bid protein reduces sepsis-induced apoptosis and inflammation, while improving septic survival

Affiliations

Deficiency of Bid protein reduces sepsis-induced apoptosis and inflammation, while improving septic survival

Chun-Shiang Chung et al. Shock. 2010 Aug.

Abstract

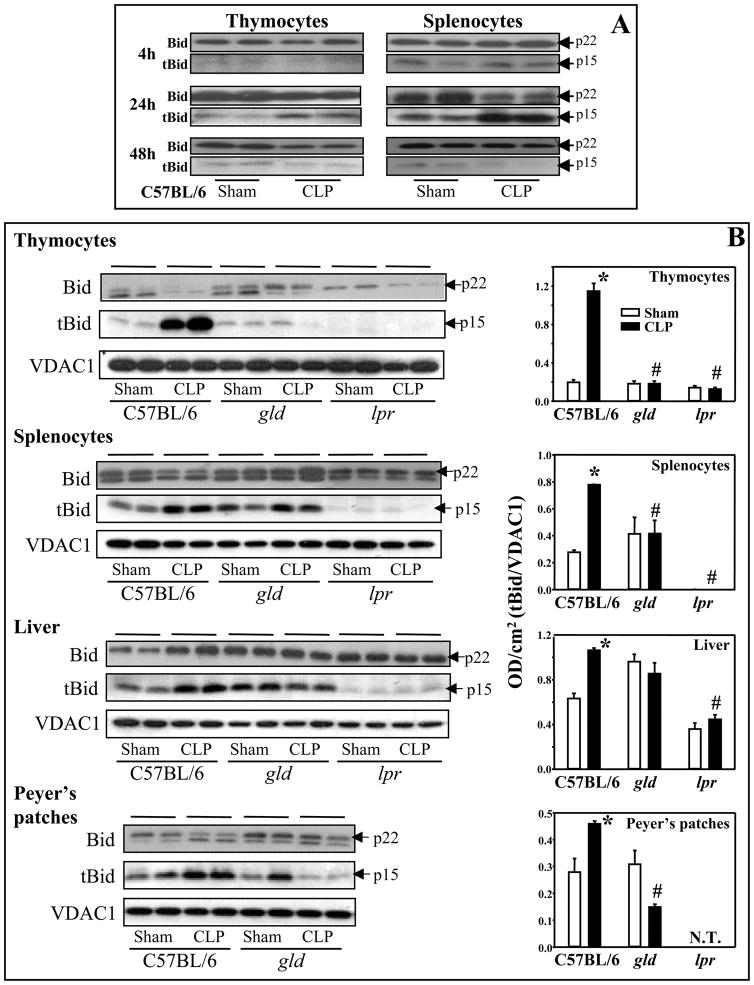
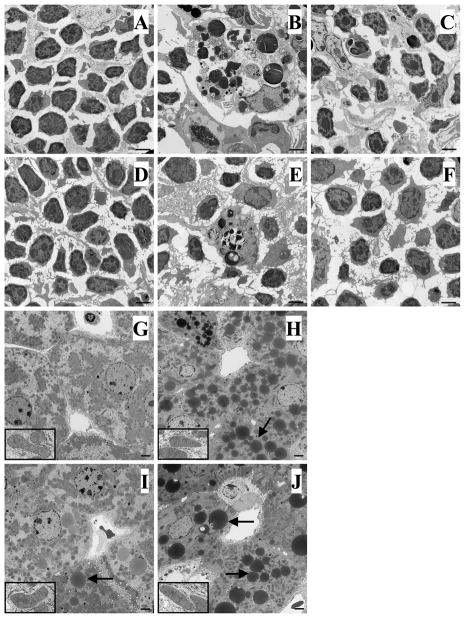
Increased apoptotic cell death is believed to play a pathological role in patients with sepsis and experimental animals. Apoptosis can be induced by either a cell death receptor (extrinsic) or a mitochondrial (intrinsic) pathway. Bid, a proapoptotic member of the Bcl-2 family, is thought to mediate the cross talk between the extrinsic and intrinsic pathways of apoptosis; however, little is known about the action of Bid in the development of apoptosis and organ-specific tissue damage/cell death as seen in polymicrobial sepsis. Our results show that after the onset of sepsis, tBid (the active form of Bid) is significantly increased in mitochondrial fractions of the thymus, spleen, Peyer patches, and liver, and that Fas or FasL deficiency blocks Bid activation in various tissues after septic challenge. Increased Bid activation is correlated with increased active caspase-3, caspase-9, and apoptosis during sepsis. Bid-deficient mice exhibit significantly reduced apoptosis in the thymus, spleen, and Peyer patches compared with background mice after sepsis. Furthermore, Bid-deficient mice had significantly reduced systemic and local inflammatory cytokine levels and improved survival after sepsis. These data support not only the contribution of Bid to sepsis-induced apoptosis and the onset of septic morbidity/mortality, but also the existence of a bridge between extrinsic apoptotic signals, e.g., FasL:Fas, TNF:TNFR, and so on, and the intrinsic mitochondrial pathway via Bid-tBid activation during sepsis.


Figures

Figure 1
Figure 1
Sepsis-induced changes in Bid activation and tBid translocation from cytosol to mitochondria that the activation was differentially affected by blockade of Fas-FasL signaling. A, C57BL/6 mice were subjected to sham or CLP. Thymocytes and splenocytes were harvested at 4, 24, and 48 hours after surgery. The extent of total Bid (p22) in cytosolic fractions and tBid (p15) protein in the mitochondrial fractions were determined by Western blot analyses. B, C57BL/6 background, gld or lpr mice were subjected to sham or CLP, and 24 hours later, thymocytes, splenocytes, liver and Peyer’s patches were harvested. The extent of total Bid and tBid were determined by Western blot analyses (left panels) and semi-quantitated by densitometry and expressed as integrated density (IDT) values of tBid relative to IDT values of VDAC1 (right panels). *, P<0.05, versus respective sham; #, P<0.05, versus C57BL/6 CLP. One-way ANOVA and a Student-Newman-Keuls’ test, Mean ± SEM; n=4–8 mice/group. N.T., not tested.
Figure 2
Figure 2
Bid deficiency improved survival following sepsis. C57BL/6 background and Bid deficient mice were subjected to CLP and ten-day survival was recorded. Bid−/− mice showed an improvement in survival when compared with C57BL/6 background mice and the difference was statistically significant (P<0.05, Logrank survival analysis; n=13–17 mice/group).
Figure 3
Figure 3
Bid deficiency reduced sepsis-induced apoptosis in thymocytes and splenocytes. Cells were isolated from C57BL/6 background or Bid−/− mice 24 hours after subjected to sham or CLP procedures. Apoptosis was determined by terminal dUTP nick-end labeling (TUNEL) assay or Propidium Iodide (PI) staining. A decreased apoptosis in thymocytes (A) and splenocytes (B) taken from Bid−/− mice after sepsis was observed when compared with C57BL/6 background mice. *, P<0.05, versus respective sham; #, P<0.05, versus C57BL/6 CLP. One-way ANOVA and a Student-Newman-Keuls’ test, Mean ± SEM; n=4-8 mice/group.
Figure 4
Figure 4
Active caspase-3 levels in Bid−/− mice were reduced after sepsis. A, thymocytes, splenocytes and Peyer’s patches were collected from C57BL/6 background or Bid−/− mice 24 hours after subjected to sham or CLP procedures. Active caspase-3 (p17/p19) was determined by Western blot analyses (left panels) and semi-quantitated by densitometry, expressed as integrated density (IDT) values of tBid relative to IDT values of β-Actin (right panels). B, Kinetics of caspase-3 activation in C57BL/6 mice after CLP. *, P<0.05, versus respective sham; #, P<0.05, versus C57BL/6 CLP. One-way ANOVA and a Student-Newman-Keuls’ test, Mean ± SEM; n=4-8 mice/group.
Figure 5
Figure 5
Deficiency of Bid reduced active caspase-9 levels in thymocytes and splenocytes after sepsis. Thymocytes, splenocytes and the liver were harvested from C57BL/6 background or Bid−/− mice 24 hours after subjected to sham or CLP procedures. Activate caspase-9 was determined by Western blot analyses (left panels) and semi-quantitated by densitometry, expressed as integrated density (IDT) values of tBid relative to IDT values of β-Actin (right panels). *, P<0.05, versus respective sham; #, P<0.05, versus C57BL/6 CLP. One-way ANOVA and a Student-Newman- Keuls’ test, Mean ± SEM; n=4-8 mice/group.
Figure 6
Figure 6
Representative H&E staining of tissue sections for detection of apoptosis by morphology examined under light microscopy. C57BL/6 background or Bid−/− mice were subjected to sham or CLP procedures and 24 hours later paraffin embedded tissue sections were prepared. Sham animals (C57BL/6 and Bid−/−) display normal histology of thymus (A), spleen (D) and Peyer’s patches (G). While septic C57BL/6 mice exhibited typical apoptotic morphology (Arrows) in all three tissues (B, thymus; E, spleen; H, Peyer’s patches) when compared with sham–operated mice, Bid deficient animals showed fewer apoptotic cells in these tissues after sepsis (C, thymus; F, spleen; I, Peyer’s patches). Original magnifications, X 400.
Figure 7
Figure 7
Representative electron micrographs of tissue sections for morphological detection of apoptosis. C57BL/6 background or Bid−/− mice were subjected to sham or CLP procedures and 24 hours later tissue sections were prepared for electron microscopy. Sham animals (C57BL/6 and Bid−/−) display normal histology of thymus (A) and spleen (D). While septic C57BL/6 mice exhibited a typically cluster of apoptotic cells in these tissues (B, thymus; E, spleen) when compared with sham– operated mice, Bid deficient animals showed fewer apoptotic cells after sepsis (C, thymus; F, spleen). Original magnification, 4400X. In the liver, the electron micrographs showed relatively normal mitochondria (inset, original magnification, 5540X) and minimum signs of apoptosis after sepsis in either C57BL/6 (H) or Bid−/− (J) mice compared with their shams (G, C57BL/6; I, Bid−/−). However, Bid−/− mice appear to have more of the lipid-like droplets (Arrows) (I, sham; J, CLP). Original magnification, 2800X.
Figure 8
Figure 8
Representative immunohistochemical staining of active caspase-3 in tissue sections. C57BL/6 background or Bid−/− mice were subjected to sham or CLP procedures and 24 hours later paraffin embedded tissue sections were prepared and stained with anti-caspase-3. Sham animals display no or slight staining of active caspase-3 in the thymus (A), spleen (D) and Peyer’s patches (G). While septic C57BL/6 mice exhibited extensive active caspase-3 staining (Arrows) in all three tissues (B, thymus; E, spleen; H, Peyer’s patches) when compared with sham–operated mice, Bid deficient animals showed less staining in these tissues after sepsis (C, thymus; F, spleen; I, Peyer’s patches). Original magnifications, X 400. Quantification of the images was processed and analyzed using iVision software. Positive staining was defined through thresholding, the resulting images were analyzed, and data were expressed as percent area stained over total area (% area stained). *, P<0.05, versus sham; #, P<0.05, versus C57BL/6 CLP. One-way ANOVA and a Student-Newman-Keuls’ test, Mean ± SEM; n=3/group.
Figure 9
Figure 9
Representative immunohistochemical TUNEL staining in tissue sections. C57BL/6 background or Bid−/− mice were subjected to sham or CLP procedures and 24 hours later paraffin embedded tissue sections were prepared and stained with TUNEL. Sham animals display no or slight staining of TUNEL in thymus (A) and spleen (D). While septic C57BL/6 mice exhibited extensive a typical apoptotic morphology in tissues (B, thymus; E, spleen) when compared with sham–operated mice, Bid deficient animals showed less TUNEL staining in these tissues after sepsis (C, thymus; F, spleen). Original magnifications, X 400. Quantification of the images was processed and analyzed using iVision software. Positive staining was defined through thresholding, the resulting images were analyzed, and data were expressed as percent area stained over total area (% area stained). *, P<0.05, versus sham; #, P<0.05, versus C57BL/6 CLP. One-way ANOVA and a Student-Newman-Keuls’ test, Mean ± SEM; n=3/group.
Figure 10
Figure 10
Cytokine/chemokine levels in plasma (circulation) and peritoneal cavity (local). C57BL/6 background or Bid−/− mice were subjected to sham or CLP procedures; 12 and 24 hours later, plasma and peritoneal fluid were collected for measurement of cytokine/chemokine concentration (pg/mL) by cytometric bead array. Plasma levels of TNF-α , MCP-1, IL-10 and IL-6 were significantly increased in septic C57BL/6 mice at 12 (A, B) and 24 (C, D) hours compared with their shams. Although TNF-α , MCP-1 and IL-6 at 12 hours and MCP-1 and IL-6 at 24 hours in septic Bid−/− mice were also increased compared with shams, these plasma cytokine/chemokine levels were significantly decreased compared with C57BL/6 mice at 24 hours and to a lesser extent at 12 hours after CLP. Bid deficiency also reduced local cytokine/chemokine production in the peritoneal cavity after CLP. MCP-1 and IL-10 levels at 12 hours (E, F) and TNF-α , MCP-1 and IL-10 levels at 24 hours (G, H) in peritoneal fluids from Bid−/− septic mice were significantly lower than those in septic C57BL/6 mice. *, P<0.05, versus respective sham; #, P<0.05, versus C57BL/6 CLP. One-way ANOVA and a Student-Newman-Keuls’ test, Mean ± SEM; n=6-8 mice/group.
Figure 10
Figure 10
Cytokine/chemokine levels in plasma (circulation) and peritoneal cavity (local). C57BL/6 background or Bid−/− mice were subjected to sham or CLP procedures; 12 and 24 hours later, plasma and peritoneal fluid were collected for measurement of cytokine/chemokine concentration (pg/mL) by cytometric bead array. Plasma levels of TNF-α , MCP-1, IL-10 and IL-6 were significantly increased in septic C57BL/6 mice at 12 (A, B) and 24 (C, D) hours compared with their shams. Although TNF-α , MCP-1 and IL-6 at 12 hours and MCP-1 and IL-6 at 24 hours in septic Bid−/− mice were also increased compared with shams, these plasma cytokine/chemokine levels were significantly decreased compared with C57BL/6 mice at 24 hours and to a lesser extent at 12 hours after CLP. Bid deficiency also reduced local cytokine/chemokine production in the peritoneal cavity after CLP. MCP-1 and IL-10 levels at 12 hours (E, F) and TNF-α , MCP-1 and IL-10 levels at 24 hours (G, H) in peritoneal fluids from Bid−/− septic mice were significantly lower than those in septic C57BL/6 mice. *, P<0.05, versus respective sham; #, P<0.05, versus C57BL/6 CLP. One-way ANOVA and a Student-Newman-Keuls’ test, Mean ± SEM; n=6-8 mice/group.

Similar articles

Cited by

References

    1. Smith JA. Neutrophils, host defense, and inflammation: a double-edged sword. J Leukocyte Biol. 1994;56:672–686. - PubMed
    1. Thompson CB. Apoptosis in the pathogenesis and treatment of disease. Science. 1995;267:1456–1462. - PubMed
    1. Zimmermann KC, Bonzon C, Green DR. The machinery of programmed cell death. Pharmac Ther. 2001;92:57–70. - PubMed
    1. Hotchkiss RS, Swanson PE, Freeman BD, Tinsley KW, Cobb JP, Matuschak GM, Buchman TG, Karl IE. Apoptotic cell death in patients with sepsis, shock and multiple organ dysfunction. Crit Care Med. 1999;27:1230–1251. - PubMed
    1. Ayala A, Chung CS, Chaudry IH. Lymphocyte apoptosis in sepsis. Sepsis. 1998;2:55–71. - PubMed

Publication types

MeSH terms