Review
. 2009 Jun;1(5-6):345-62.
doi: 10.1039/b905502a. Epub 2009 May 7.

Microparticle encoding technologies for high-throughput multiplexed suspension assays

Affiliations
Review

Microparticle encoding technologies for high-throughput multiplexed suspension assays

Sam Birtwell et al. Integr Biol (Camb). 2009 Jun.

Abstract

The requirement for analysis of large numbers of biomolecules for drug discovery and clinical diagnostics has driven the development of low-cost, flexible and high-throughput methods for simultaneous detection of multiple molecular targets in a single sample (multiplexed analysis). The technique that seems most likely to satisfy all of these requirements is the multiplexed suspension (bead-based) assay, which offers a number of advantages over alternative approaches such as ELISAs and microarrays. In a bead based assay, different probe molecules are attached to different beads (of a few tens of microns in size), which are then reacted in suspension with the target sample. After reaction, the beads must be identifiable in order to determine the attached probe molecule, and thus each bead must be labelled (encoded) with a unique identifier. A large number of techniques have been proposed for encoding beads. This critical review analyses each technology on the basis of its ability to fulfil the practical requirements of assays, whilst being compatible with low-cost, high-throughput manufacturing processes and high-throughput detection methods. As a result, we identify the most likely candidates to be used for future integrated device development for practical applications.


Figures

Fig1
Fig1
Principle of an antibody microarray. (A) Probeantigens corresponding to different target antibodies are attached to a glass slide in an array format. (B) The slide is reacted with a solution containing target antibodies corresponding to two of the antigens. A fluorescent label antibody is then attached to the target antibody, so that the spots containing target become fluorescent, indicating binding. The spatial position of the fluorescent spot identifies the antigen and hence the target antibody.
Fig2
Fig2
Principle of a bead based assay. The assay proceeds in the same manner as microarray assay, however, instead of the probe molecules being attached to different site on a slide, each probe is attached to a different bead. Since the beads do not have a well defined position, each must have some kind of code which allows it to be identified after the reactions have taken place.
Fig3
Fig3
(A) Fluorescence intensities from six beads containing different quantities of a fluorescent dye. The fluorescence intensity of a particular bead constitutes its identifying code (reprinted from ref. 24, copyright 2004, with permission from Elsevier). (B) Absorption spectrum (black points) and emission spectra (coloured points) of six different sized CdSe cored quantum dots. (C) Fluorescence emission from the six dots, showing the QD sizes and corresponding peak emission wavelength (B and C adapted by permission from Macmillan Publishers Ltd: Nature Materials, copyright 2005).
Fig4
Fig4
(A) Fluorescence false-colour images of two types of rare-earth doped glass encoded microparticles. (B) Emission spectra of each type of element used to make up the various barcodes (adapted with permission from ref. 34, copyright © 2003, The National Academy of Sciences).
Fig5
Fig5
Schematic of the procedure for immobilization of probeoligonucleotides to polystyrene beads, followed by hybridization to target DNA and nanobarcode reporter probes (reprinted by permission from Macmillan Publishers Ltd: Nature Biotechnology, copyright 2005).
Fig6
Fig6
Process for binding and readout of NanoString barcodes. (A) Capture probes and reporter probes are reacted with a sample and bind to complementary RNA strands. (B) The biotinylated capture probes are immobilized on a streptavidin coated slide. The reporter probes are all aligned in the same direction by an electric field, and fixed to the slide via short biotinylated RNA strands. (C) Fluorescence microscope images are analyzed along the alignment direction to readout the codes (adapted by permission from Macmillan Publishing Ltd: Nature Biotechnology, copyright 2008).
Fig7
Fig7
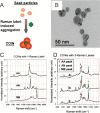
(A) Aggregation of silver seed nanoparticles and Raman labels in silver nitrate produce composite organic–inorganic nanoparticles shown in the TEM in (B). (C) Raman spectra of the COINs, showing particular dominant peaks, whose Raman shift depends on the particular organic Raman label used. The dominant peak position constitutes the code identifying the COINs. (D) Use of more than one Raman label produces spectra with multiple peaks, the combinations of which allow for increased numbers of codes (adapted with permission from ref. 37, copyright 2005, American Chemical Society).
Fig8
Fig8
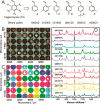
Polystyrene beads fabricated using combinations of different styrene monomers (A) are arranged in wells on a substrate (B), and scanned in steps, taking a Raman spectrum at each step. Each bead (C) is then associated with a particular spectrum (D), as indicated by the corresponding colour codes. Each Raman spectrum constitutes a code identifying a bead (reprinted from ref. 38, copyright 2007, with permission from Elsevier).
Fig9
Fig9
(A) Gold nanodisk arrays are created by electroplating of gold/nickel wires, followed by etching of the nickel to leave the nanodisk arrays. The arrays are functionalized with Raman probes. (B) Binary codes identifying the array are made by arranging sequences of ‘0’ (nanodisk absent) and ‘1’ (nanodisk present). (C) The binary code is read by observing the arrays using confocal Raman spectroscopy (adapted with permission from ref. 40, copyright 2007, American Chemical Society).
Fig10
Fig10
(A) Reflectance spectra of periodically porous silicon photonic crystal microparticles, with different periodicities of porosity variation. (B) In addition to particles with single periodic porosity variations (bottom spectrum), particles with multiple periodicities can be fabricated, allowing for a larger number of codes (reprinted by permission from Macmillan Publishers Ltd: Nature Materials, copyright 2002).
Fig11
Fig11
(A) Reflection spectra from inverse-opaline photonic beads with seven different pore sizes. (B) Spectral shifts induced in two kinds of beads due to antigen binding, showing label-free binding detection functionality. The third bead has not exhibited this shift (reproduced with permission from ref. 43, copyright Wiley-VCH Verlag GmbH & Co. KGaA).
Fig12
Fig12
(A) Absorbance spectra of suspensions of goldnanorods with various aspect ratios. (B) Absorption spectrum of a suspension containing rods of three different aspect ratio, demonstrating the shift upon detection of a target complementary to probes on one of the rod types (adapted with permission from ref. 44, copyright 2007, American Chemical Society).
Fig13
Fig13
(A) Optical micrograph of encoded metallic nanowires after release from their aluminaelectroplating template (reprinted with permission from ref. 45, copyright AAAS). (B) Optical micrograph of a 3DMS ImageCode. The L-shaped pattern of holes indicate the orientation, and the central holes constitute a binary code. (C) Optical micrograph of a 3DMS FloCode. The pattern of ridges along the edge is a binary code, read by recording the fluctuations of scattered laser light as the particle flows through a laser beam (B and C reprinted with permission from ref. 49. The publisher for this copyrighted material is Mary Ann Liebert, Inc. publishers). (D) Optical micrograph of encoded aluminium rods manufactured by Pronostics Ltd, as used in their UltraPlex system (reproduced courtesy of Pronostics Ltd).
Fig14
Fig14
(A) Particles moulded in nickel/PTFE/gold using SU8, encoded using patterns of holes depicting a binary code (adapted with permission from ref. 51, copyright 2007, American Chemical Society). (B) Particles with three different codes are coated with IgA, IgG or IgM and a particle with fourth code remain uncoated and are used as a control. (C) A fluorescence image of the particles after reaction reveals little binding of the target analyte to the control particles (B and C reprinted with permission from ref. 52, copyright 2003, Elsevier).
Fig15
Fig15
(A) Particles manufactured in-flow from a PEG photopolymer. Two flow streams contain fluorescent labeled PEG for the code section of the particle and PEG with probe attached for the analyte section of the particle. (B) The resulting particles contain a code featuring orientation digits and the code digits themselves, and an analyte region, both of which are read along the lines defined by the arrows. (C) Three types of coded particle, allow the binding of different oligonucleotides O1 and O2 to be compared to a control region Ctl (reprinted with permission from ref. 54, copyright AAAS).
Fig16
Fig16
(A) Silicon microbars encoded with patterned aluminium. (B) Reflectance traces of 633 nm laser light recorded from flowing silicon microparticles allow successful identification in flow speeds up to 10 cm s−1 (A and B reprinted from ref. 55, copyright 2007, with permission from Elsevier). (C) An SU8 microbar encoded with patterned aluminium. (D) RF reflectance traces allow identification of SU8 bars in flow at similar speeds to that recorded for the silicon bars (C and D reproduced from ref. 56, copyright 2007, RSC).
Fig17
Fig17
(A) Process for manufacturing grating-based SPR encoded microparticles (‘graticles’). (B) An example microparticle, showing the orientation marker (triangular notch) and code marks (square notches). (C) Method for readout of the SPR bands to detect molecular binding. (D) SPR image showing the dark bands due to the plasmon absorption, the position of which indicates whether molecules have bound to the particle surface (adapted with permission from ref. 57, copyright 2007, American Chemical Society).
Fig18
Fig18
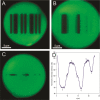
Codes written into fluorescent microspheres by photobleaching. Codes are written as bars of different width, and may be of two (A) or three (B) intensity levels. Write time is minimized by creating ‘dot codes’ (C), and a cross section through such a dot code (D) indicates the ability to distinguish the three fluorescence levels (adapted by permission from Macmillan Publishers Ltd: Nature Materials, copyright 2003).
Fig19
Fig19
(A) SEM image of a 2× superimposed encoded tag on an SU8 film nano-imprinted using an electroformed nickel imprint master. (B) A similar tag imprinted onto an SU8 microparticle. (C) Diffraction patterns in air created by nano-imprinted 1D SU8 tags containing two superimposed gratings. Moving from left to right shows how a progressive decrease in the pitch of one of the gratings changes the diffraction pattern. (D) Example diffraction patterns from 2D gratings. (E) An image of the reconstructed diffraction pattern from a hologram written into a 1500 × 500 × 35 μm SU8 particle. Image is contrast enhanced for clarity. (F) A cross section through the unenhanced image showing the pattern signal-to-noise ratio. (G) The Illumina VeraCode Technology in which a glass bead containing an etched hologram is illuminated with a laser beam producing a code image (copyright 2006, Illumina, Inc., reprinted with permission).
None
None

Similar articles

Cited by

References

    1. Kindt T. J., Goldsby R. A. andOsborne B. A.,Immunology,W. H. Freeman and Company,New York, 6th edn,2007.
    1. AbCam ELISA Kits specifications: http://www.abcam.com.
    1. Quansys Bio multiplex ELISA kit specifications: http://www.quansysbio.com/.
    1. Pierce multiplex ELISA kit specifications: http://www.piercenet.com/.
    1. Ray Biotech multiplex ELISA kit specifications:http://www.raybiotech.com/.