. 2009 Jan;1(1):70-9.
doi: 10.1039/b816472j. Epub 2008 Nov 12.

Human mammary progenitor cell fate decisions are products of interactions with combinatorial microenvironments

Affiliations

Human mammary progenitor cell fate decisions are products of interactions with combinatorial microenvironments

Mark A LaBarge et al. Integr Biol (Camb). 2009 Jan.

Abstract

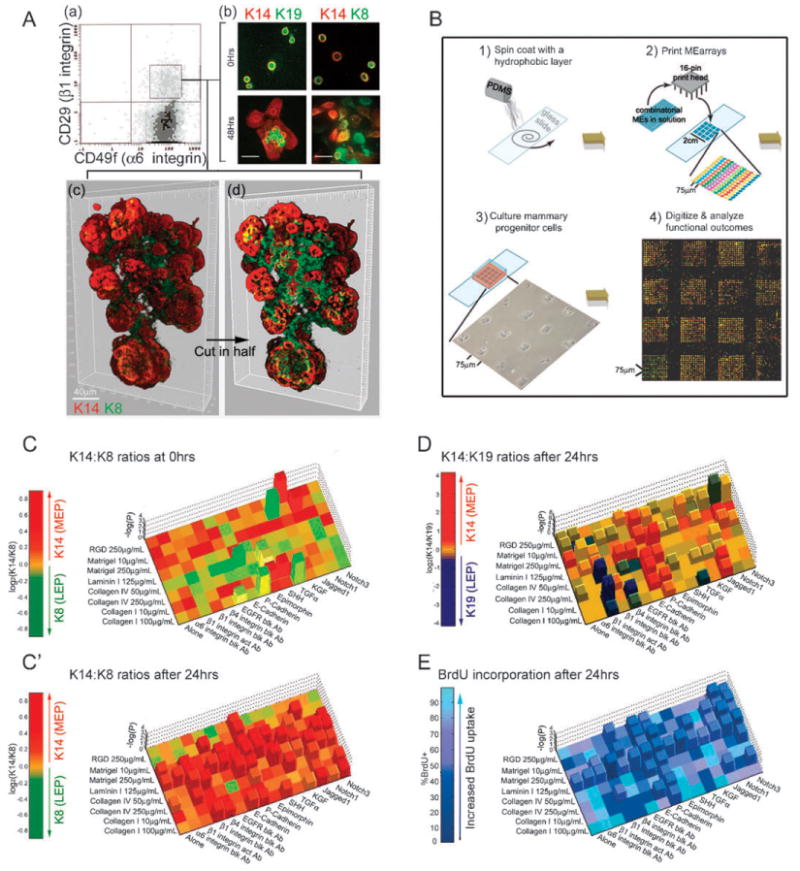
In adult tissues, multi-potent progenitor cells are some of the most primitive members of the developmental hierarchies that maintain homeostasis. That progenitors and their more mature progeny share identical genomes, suggests that fate decisions are directed by interactions with extrinsic soluble factors, ECM, and other cells, as well as physical properties of the ECM. To understand regulation of fate decisions, therefore, would require a means of understanding carefully choreographed combinatorial interactions. Here we used microenvironment protein microarrays to functionally identify combinations of cell-extrinsic mammary gland proteins and ECM molecules that imposed specific cell fates on bipotent human mammary progenitor cells. Micropatterned cell culture surfaces were fabricated to distinguish between the instructive effects of cell-cell versus cell-ECM interactions, as well as constellations of signaling molecules; and these were used in conjunction with physiologically relevant 3 dimensional human breast cultures. Both immortalized and primary human breast progenitors were analyzed. We report on the functional ability of those proteins of the mammary gland that maintain quiescence, maintain the progenitor state, and guide progenitor differentiation towards myoepithelial and luminal lineages.


Figures

Fig. 1
Fig. 1
Mammary progenitor cells make distinctive cell fate decisions in response to different combinatorial microenvironments. (A) CD49f and CD29 expression in D920 parental cells cultured on collagen-coated plates was determined by FACS: (a) A distinctive CD29hi subpopulation (box, 1–3% of total) can be identified, although most of the cells in the population express at least some CD29. The CD29hi population (designated D920 progenitors) was FACS-sorted and stained to determine (b) expression of keratin (K) 8, 14, and 19 as a function of time in culture, immediately after isolation (0 h) and 48 h later on 2D cultures. (c) A deconvoluted 3D reconstruction is shown of a TDLU grown from a single CD29hi cell that was embedded in 3D Matrigel for 20 days. Staining for markers of myoepithelial cells (K14, red) and of luminal epithelial cells (K8, green) is shown in an opaque representation of the TDLU). (d) A digital slice through (c) to enable visualization of the inner K8+ cells. Bars represent 40 μm. (B) Microenvironment microarrays (MEArrays) were fabricated as described in material and methods, steps 1 and 2. D920 progenitor cells were isolated as described in Fig. 1A and cultured on MEArrays, step 3. The arrays were immuno-stained for K8/K14, K19/K14 or BrdU incorporation after 24 h, and digitized with a microarray scanner, step 4. (C–D) Results are expressed as log2 of the K14 : K8 or K14 : K19 ratio of mean intensity (e.g. log2(1/1) = 0), where increases in K14 (myoepithelial-like, red) or in K8 or K19 (luminal-like, green or blue, respectively) expression on any given microenvironment are compared to the keratin ratios in cells grown on collagen I microenvironments, which serves as a control baseline. Two-color heat maps used to represent ratiometric data were modified by also including a z-axis (–log10(p)), only for those microenvironments that induced a significant (at least p < 0.05 by Dunnette's test) change in the mean keratin ratios. (E) Progenitors were treated with BrdU for the final 4 h of a 24 h incubation to determine the microenvironmental effects on cell proliferation. The percent BrdU pixels (stained with anti-BrdU) of total DNA pixels (stained with Topro3) for all of the pair-wise combinations.
Fig. 2
Fig. 2
The MEArray-identified proteins are expressed proximal to the putative stem cell niche in vivo. Normal reduction mammoplasty specimens were sectioned and evaluated by immunofluorescence to determine where the MEArray-identified proteins are expressed relative to cells expressing the putative mammary stem cell marker K15 (red, in all images) in the terminal ducts. For all antibody combinations, images are shown of terminal ducts, which contain K15+ cells, and of lobules, which do not contain K15+ cells. (A) Laminin1 (laminin-111) (green) surrounds the glands as part of the basement membrane, K15+ cells can be seen forming occasional protrusions that contact the laminin1. (B) Jagged1 (green) is expressed in the myoepithelial cells, and based on the yellow-appearing overlap, also in some K15+ ductal cells. (C) P-cadherin (green) is expressed on the basal and lateral edges of myoepithelial cells. (D) E-cadherin (green) is strongly expressed in the luminal layer including K15+ cells.
Fig. 3
Fig. 3
Cell–cell contact is necessary for induction of the luminal-like phenotype. To control cell–cell contact, D920 progenitor cells were cultured on collagen I that was micropatterned into arrays of 1600 μm2 square-shaped features for 24 h. (A–D) Contour plots are shown of the absolute intensities of K8 and K14 expressed in individual cells. These range from 0 to 255 arbitrary fluorescence units (afu) (150 cells/plot/experiment unless otherwise indicated, n = 3). (A) K8/K14 profiles at 0 h immediately after adhesion, (B) after 24 h where only one cell was bound per feature (73 cells), (C) after 24 h where 2–4 cells were bound to each feature enabling cell–cell contact, and (D) after 24 h with one cell per feature plus the addition of recombinant E-cadherin-conjugated silicon beads to mimic cell-cell contact. Representative immunoflourescence images of DAPI stain (blue), and K8 (green) and K14 (red) expression in D920 progenitors (E) after 24 h of culture on collagen patterns, and (F) after 24 h on patterns with E-cadherin beads, fluorescence image is merged with a phase image to aid in visualization of the beads. (E) Single arrows identify features with only one cell, two arrows identify features with >2 cells. (F) Arrows identify single cells touching beads. (G–H) Histograms represent the absolute fluorescence intensity of Gata3 expression per cell, which ranges in value from 0 to 255 afu (75 single cells/histogram/experiment, n = 2). (G) Gata3 expression in D920 progenitor cells grown on collagen patterns that were permitted cell-cell contact. (H) Gata3 expression in cells 24 h after single D920 progenitors were grown together with either collagen I-coated or E-cadherin-coated beads. p values were determined with Mann–Whitney tests.
Fig. 4
Fig. 4
Jagged1- and P-cadherin-induced keratin phenotypes in D920 and in primary human breast progenitor cells results from the integration of multiple pathways. To determine the fate decision outcomes after induction of Notch and P-cadherin pathways in physiological culture conditions, D920 progenitor cells were cultured in 3D Matrigel. (A) K14 (red)/K19 (green) expression in D920 progenitor cells cultured for 10 days with or without 50 μg mL−1 of the recombinant Jagged1 or P-cadherin proteins. Bars represent 40 μm. (B–B′) D920 progenitors were cultured in 3D Matrigel for 24 h in the presence or absence of 10 μg mL−1 Jagged1 or P-cadherin. Fluorescence intensity values for K14 and K19 expression were determined for each cell (150 cells per condition). (B) Histograms of log2(K14/K19) expression displays the distribution of keratin phenotypes that are achieved by D920 progenitors in control, Jagged1- or P-cadherin-containing cultures. (n = 3). (B′) Small molecule inhibitors were added to the 3D cultures to identify those which blocked the Jagged1- and P-cadherin-directed cell-fate decisions (n = 2). (C) The CD29hi subpopulation of primary human mammary epithelial cells from a reduction mammoplasty specimen were cultured in 3D Matrigel for 24 h (n = 2). Histograms of log2(K14/K19) expression displays the distribution of keratin phenotypes that are achieved by primary progenitors in control, Jagged1- or P-cadherin-containing cultures. Mean log2(K14/K19) values (); the absolute range of values are in parenthesis. p values were determined with Mann–Whitney tests.

References

    1. Bissell MJ. Int Rev Cytol. 1981;70:27–100. - PubMed
    1. Scadden DT. Nature. 2006;441:1075–1079. - PubMed
    1. Potten CS, Loeffler M. Development. 1990;110:1001–1020. - PubMed
    1. Bissell MJ, Labarge MA. Cancer Cell. 2005;7:17–23. - PMC - PubMed
    1. LaBarge MA, Petersen OW, Bissell MJ. Stem Cell Rev. 2007;3:137–146. - PMC - PubMed

Publication types