Mapping mammary gland architecture using multi-scale in situ analysis
- PMID: 20023794
- PMCID: PMC2847439
- DOI: 10.1039/b816933k
Mapping mammary gland architecture using multi-scale in situ analysis
Abstract
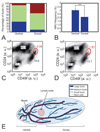
We have built a novel computational microscopy platform that integrates image acquisition, storage, processing and analysis to study cell populations in situ. This platform allows high-content studies where multiple features are measured and linked at multiple scales. We used this approach to study the cellular composition and architecture of the mouse mammary gland by quantitatively tracking the distribution and type, position, proliferative state, and hormone receptor status of epithelial cells that incorporated bromodeoxyuridine while undergoing DNA synthesis during puberty and retained this label in the adult gland as a function of tissue structure. Immunofluorescence was used to identify label-retaining cells, as well as epithelial cells expressing the proteins progesterone receptor and P63. Only 3.6% of luminal cells were label-retaining cells, the majority of which did not express the progesterone receptor. Multi-scale in situ analysis revealed that luminal label-retaining cells have a distinct nuclear morphology, are enriched 3.4-fold in large ducts, and are distributed asymmetrically across the tissue. We postulated that LRC enriched in the ventral mammary gland represent progenitor cells. Epithelial cells isolated from the ventral versus the dorsal portion of the gland were enriched for the putative stem cell markers CD24 and CD49f as measured by fluorescence activated cell sorting. Thus, quantitative analysis of the cellular composition of the mammary epithelium across spatial scales identified a previously unrecognized architecture in which the ventral-most, large ducts contain a reservoir of undifferentiated, putative stem cells.
Figures


Similar articles
-
CD24 and CD49f expressions of E14.5 mouse mammary anlagen cells define putative distribution of earlier embryonic mammary stem cell activities.Biochem Cell Biol. 2018 Oct;96(5):539-547. doi: 10.1139/bcb-2017-0177. Epub 2018 Apr 5. Biochem Cell Biol. 2018. PMID: 29620414
-
Cell hierarchy and lineage commitment in the bovine mammary gland.PLoS One. 2012;7(1):e30113. doi: 10.1371/journal.pone.0030113. Epub 2012 Jan 13. PLoS One. 2012. PMID: 22253899 Free PMC article.
-
SCA-1 Labels a Subset of Estrogen-Responsive Bipotential Repopulating Cells within the CD24+ CD49fhi Mammary Stem Cell-Enriched Compartment.Stem Cell Reports. 2017 Feb 14;8(2):417-431. doi: 10.1016/j.stemcr.2016.12.022. Epub 2017 Jan 26. Stem Cell Reports. 2017. PMID: 28132885 Free PMC article.
-
[Characterization of stem cells from the murine adult mammary gland].Med Sci (Paris). 2007 Dec;23(12):1125-31. doi: 10.1051/medsci/200723121125. Med Sci (Paris). 2007. PMID: 18154715 Review. French.
-
Morphogenic and tumorigenic potentials of the mammary growth hormone/growth hormone receptor system.Mol Cell Endocrinol. 2002 Nov 29;197(1-2):153-65. doi: 10.1016/s0303-7207(02)00259-9. Mol Cell Endocrinol. 2002. PMID: 12431808 Review.
Cited by
-
Establishing estrogen-responsive mouse mammary organoids from single Lgr5+ cells.Cell Signal. 2017 Jan;29:41-51. doi: 10.1016/j.cellsig.2016.08.001. Epub 2016 Aug 7. Cell Signal. 2017. PMID: 27511963 Free PMC article.
-
Progesterone stimulates proliferation of a long-lived epithelial cell population in rat mammary gland.J Endocrinol Invest. 2012 Oct;35(9):828-34. doi: 10.3275/8189. Epub 2011 Dec 16. J Endocrinol Invest. 2012. PMID: 22186344
-
Radiation acts on the microenvironment to affect breast carcinogenesis by distinct mechanisms that decrease cancer latency and affect tumor type.Cancer Cell. 2011 May 17;19(5):640-51. doi: 10.1016/j.ccr.2011.03.011. Cancer Cell. 2011. PMID: 21575864 Free PMC article.
-
Mammary gland development.Wiley Interdiscip Rev Dev Biol. 2012 Jul-Aug;1(4):533-57. doi: 10.1002/wdev.35. Wiley Interdiscip Rev Dev Biol. 2012. PMID: 22844349 Free PMC article. Review.
-
Embryonic cells contribute directly to the quiescent stem cell population in the adult mouse mammary gland.Breast Cancer Res. 2014 Dec 3;16(6):487. doi: 10.1186/s13058-014-0487-6. Breast Cancer Res. 2014. PMID: 25467960 Free PMC article.
References
-
- Fowlkes CC, Hendriks CL, Keranen SV, Weber GH, Rubel O, Huang MY, Chatoor S, DePace AH, Simirenko L, Henriquez C, Beaton A, Weiszmann R, Celniker S, Hamann B, Knowles DW, Biggin MD, Eisen MB, Malik J. Cell. 2008;133:364–374. - PubMed
-
- Clarke RB, Howell A, Potten CS, Anderson E. Cancer Res. 1997;57:4987–4991. - PubMed
-
- Topper YJ, Freeman CS. Physiol. Rev. 1980;60:1049–1105. - PubMed
Publication types
MeSH terms
Substances
Grants and funding
LinkOut - more resources
Full Text Sources
Other Literature Sources
Medical
Research Materials

