

2D-PCR: a method of mapping DNA in tissue sections
- PMID: 20024032
- PMCID: PMC2910845
- DOI: 10.1039/b910807f
2D-PCR: a method of mapping DNA in tissue sections
Abstract
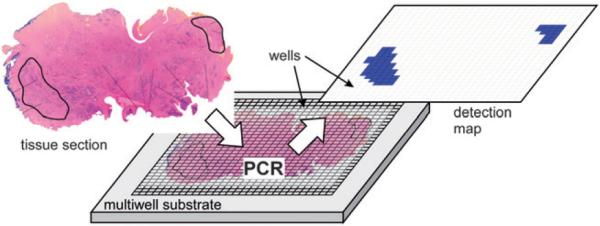
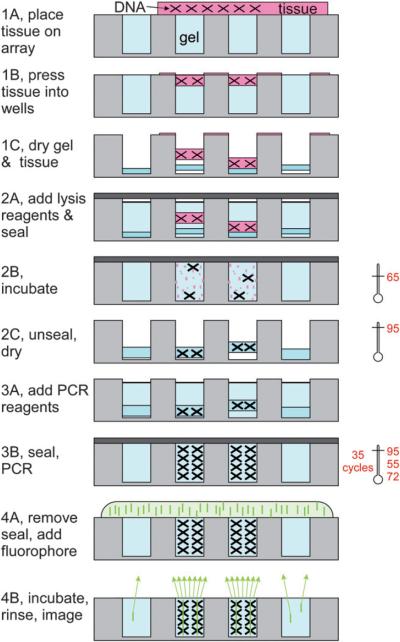
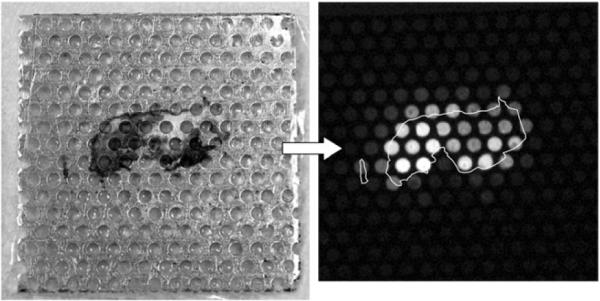
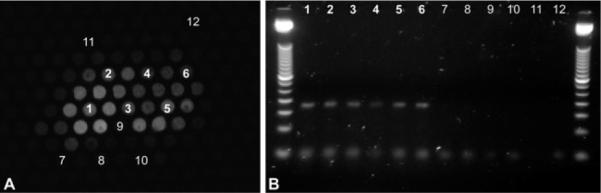
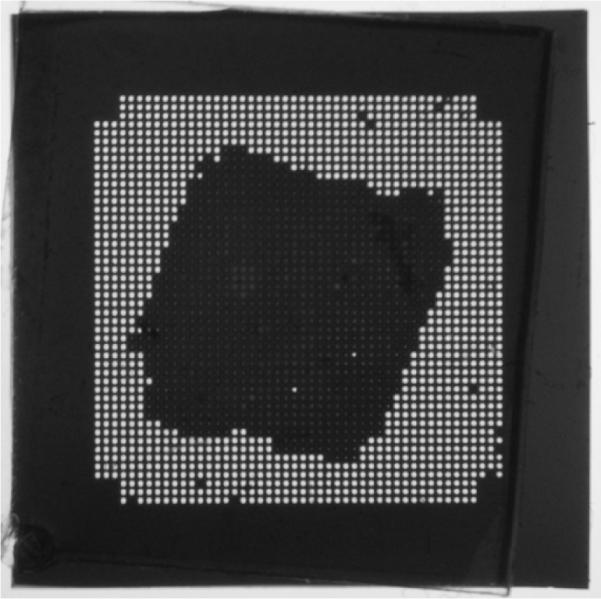
A novel approach was developed for mapping the location of target DNA in tissue sections. The method combines a high-density, multi-well plate with an innovative single-tube procedure to directly extract, amplify, and detect the DNA in parallel while maintaining the two-dimensional (2D) architecture of the tissue. A 2D map of the gene glyceraldehyde 3-phosphate dehydrogenase (GAPDH) was created from a tissue section and shown to correlate with the spatial area of the sample. It is anticipated that this approach may be easily adapted to assess the status of multiple genes within tissue sections, yielding a molecular map that directly correlates with the histology of the sample. This will provide investigators with a new tool to interrogate the molecular heterogeneity of tissue specimens.
Figures
Similar articles
-
A simple device using magnetic transportation for droplet-based PCR.Biomed Microdevices. 2007 Oct;9(5):695-702. doi: 10.1007/s10544-007-9078-y. Biomed Microdevices. 2007. PMID: 17505884
-
Miniaturized flow-through PCR with different template types in a silicon chip thermocycler.Lab Chip. 2001 Sep;1(1):42-9. doi: 10.1039/b103846j. Epub 2001 Aug 9. Lab Chip. 2001. PMID: 15100888
-
Cloning of glyceraldehyde-3-phosphate dehydrogenase from an Antarctic psychrophilic bacterium by inverse and splinkerette PCR.J Basic Microbiol. 2008 Oct;48(5):430-5. doi: 10.1002/jobm.200800008. J Basic Microbiol. 2008. PMID: 18759222
-
PCR microfluidic devices for DNA amplification.Biotechnol Adv. 2006 May-Jun;24(3):243-84. doi: 10.1016/j.biotechadv.2005.10.002. Epub 2005 Dec 2. Biotechnol Adv. 2006. PMID: 16326063 Review.
-
Effects of fixative and fixation time on the extraction and polymerase chain reaction amplification of RNA from paraffin-embedded tissue. Comparison of two housekeeping gene mRNA controls.Diagn Mol Pathol. 1994 Sep;3(3):148-55. doi: 10.1097/00019606-199409000-00003. Diagn Mol Pathol. 1994. PMID: 7981889 Review.
Cited by
-
Quantifying mRNA levels across tissue sections with 2D-RT-qPCR.Anal Bioanal Chem. 2011 Jul;400(10):3383-93. doi: 10.1007/s00216-011-5062-8. Epub 2011 May 11. Anal Bioanal Chem. 2011. PMID: 21559756 Free PMC article.
-
Multiplex quantitative measurement of mRNAs from fixed tissue microarray sections.Appl Immunohistochem Mol Morphol. 2014 May-Jun;22(5):323-30. doi: 10.1097/PDM.0000000000000039. Appl Immunohistochem Mol Morphol. 2014. PMID: 24809843 Free PMC article. Review.
References
-
- Mullis K, Faloona F, Scharf S, Saiki R, Horn G, Erlich H. Specific enzymatic amplification of DNA in-vitro—the polymerase chain-reaction. Cold Spring Harbor Symp. Quant. Biol. 1986;51:263–273. - PubMed
-
- Higuchi R, Fockler C, Dollinger G, Watson R. Kinetic PCR analysis—real-time monitoring of DNA amplification reactions. Bio/Technology. 1993;11:1026–1030. - PubMed
-
- Erickson HS, Albert PS, Gillespie JW, Wallis BS, Rodriguez-Canales J, Linehan WM, Gonzalez S, Velasco A, Chuaqui RF, Emmert-Buck MR. Assessment of normalization strategies for quantitative RT-PCR using microdissected tissue samples. Lab. Invest. 2007;87:951–962. - PubMed
- Erickson HS, Albert PS, Gillespie JW, Rodriguez-Canales J, Linehan WM, Pinto PA, Chuaqui RF, Emmert-Buck MR. Quantitative RT-PCR gene expression analysis of microdissected tissue samples. Nat. Protoc. 2009;4:902–922. - PMC - PubMed
-
- Dahl A, Sultan M, Jung A, Schwartz R, Lange M, Steinwand M, Livak KJ, Lehrach H, Nyarsik L. Quantitative PCR based expression analysis on a nanoliter scale using polymer nano-well chips. Biomed. Microdevices. 2007;9:307–314. - PubMed
Publication types
MeSH terms
Substances
Grants and funding
LinkOut - more resources
Full Text Sources
Other Literature Sources
Research Materials