

Highly parallel introduction of nucleic acids into mammalian cells grown in microwell arrays
- PMID: 20024036
- PMCID: PMC3033197
- DOI: 10.1039/b913794g
Highly parallel introduction of nucleic acids into mammalian cells grown in microwell arrays
Abstract
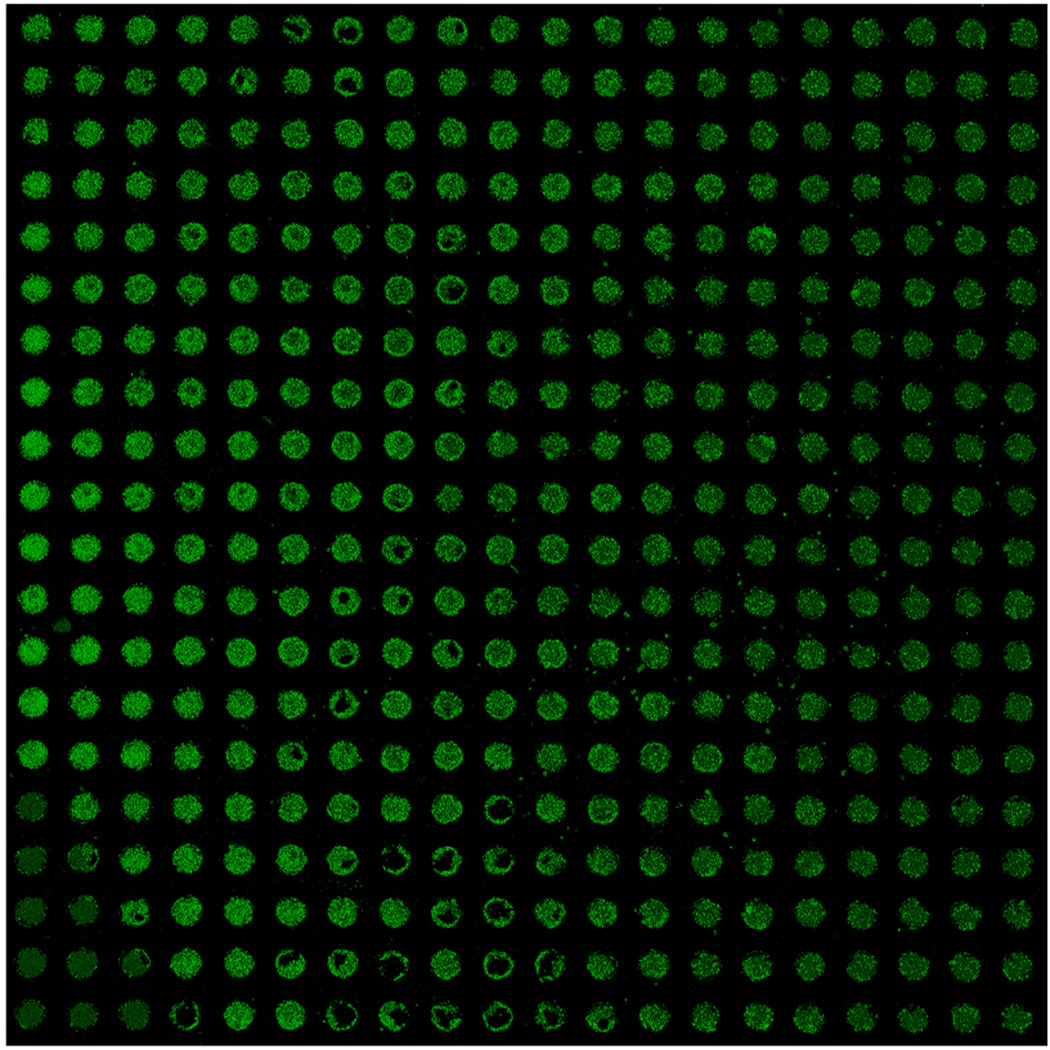
High-throughput cell-based screens of genome-size collections of cDNAs and siRNAs have become a powerful tool to annotate the mammalian genome, enabling the discovery of novel genes associated with normal cellular processes and pathogenic states, and the unravelling of genetic networks and signaling pathways in a systems biology approach. However, the capital expenses and the cost of reagents necessary to perform such large screens have limited application of this technology. Efforts to miniaturize the screening process have centered on the development of cellular microarrays created on microscope slides that use chemical means to introduce exogenous genetic material into mammalian cells. While this work has demonstrated the feasibility of screening in very small formats, the use of chemical transfection reagents (effective only in a subset of cell lines and not on primary cells) and the lack of defined borders between cells grown in adjacent microspots containing different genetic material (to prevent cell migration and to aid spot location recognition during imaging and phenotype deconvolution) have hampered the spread of this screening technology. Here, we describe proof-of-principles experiments to circumvent these drawbacks. We have created microwell arrays on an electroporation-ready transparent substrate and established procedures to achieve highly efficient parallel introduction of exogenous molecules into human cell lines and primary mouse macrophages. The microwells confine cells and offer multiple advantages during imaging and phenotype analysis. We have also developed a simple method to load this 484-microwell array with libraries of nucleic acids using a standard microarrayer. These advances can be elaborated upon to form the basis of a miniaturized high-throughput functional genomics screening platform to carry out genome-size screens in a variety of mammalian cells that may eventually become a mainstream tool for life science research.
Figures


Similar articles
-
High efficiency, site-specific transfection of adherent cells with siRNA using microelectrode arrays (MEA).J Vis Exp. 2012 Sep 13;(67):e4415. doi: 10.3791/4415. J Vis Exp. 2012. PMID: 23007885 Free PMC article.
-
In situ electroporation of surface-bound siRNAs in microwell arrays.Lab Chip. 2012 Mar 7;12(5):939-47. doi: 10.1039/c2lc20931d. Epub 2012 Jan 16. Lab Chip. 2012. PMID: 22245984 Free PMC article.
-
The construction of an individually addressable cell array for selective patterning and electroporation.Lab Chip. 2011 Jul 21;11(14):2417-23. doi: 10.1039/c1lc20183b. Epub 2011 May 31. Lab Chip. 2011. PMID: 21625729
-
Functional genomics using high-throughput RNA interference.Drug Discov Today. 2005 Feb 1;10(3):205-12. doi: 10.1016/S1359-6446(04)03352-5. Drug Discov Today. 2005. PMID: 15708535 Review.
-
Electroporation Knows No Boundaries: The Use of Electrostimulation for siRNA Delivery in Cells and Tissues.J Biomol Screen. 2015 Sep;20(8):932-42. doi: 10.1177/1087057115579638. Epub 2015 Apr 7. J Biomol Screen. 2015. PMID: 25851034 Free PMC article. Review.
Cited by
-
Micro- and Nanoscale Technologies for Delivery into Adherent Cells.Trends Biotechnol. 2016 Aug;34(8):665-678. doi: 10.1016/j.tibtech.2016.05.003. Epub 2016 Jun 7. Trends Biotechnol. 2016. PMID: 27287927 Free PMC article. Review.
-
High efficiency, site-specific transfection of adherent cells with siRNA using microelectrode arrays (MEA).J Vis Exp. 2012 Sep 13;(67):e4415. doi: 10.3791/4415. J Vis Exp. 2012. PMID: 23007885 Free PMC article.
-
Controllable in-situ cell electroporation with cell positioning and impedance monitoring using micro electrode array.Sci Rep. 2016 Aug 10;6:31392. doi: 10.1038/srep31392. Sci Rep. 2016. PMID: 27507603 Free PMC article.
-
A Simple Method for Fabrication of Microstructures Using a PDMS Stamp.Micromachines (Basel). 2016 Oct 1;7(10):173. doi: 10.3390/mi7100173. Micromachines (Basel). 2016. PMID: 30404347 Free PMC article.
-
Microfluidic electroporation for cellular analysis and delivery.Lab Chip. 2013 Oct 7;13(19):3803-21. doi: 10.1039/c3lc50566a. Lab Chip. 2013. PMID: 23917998 Free PMC article. Review.
References
-
- Moffat J, Sabatini DM. Nat Rev Mol Cell Biol. 2006;7:177–187. - PubMed
-
- Hannon GJ, Rossi JJ. Nature. 2004;431:371–378. - PubMed
-
- Elbashir SM, Harborth J, Lendeckel W, Yalcin A, Weber K, Tuschl T. Nature. 2001;411:494–498. - PubMed
-
- Fire A, Xu S, Montgomery MK, Kostas SA, Driver SE, Mello CC. Nature. 1998;391:806–811. - PubMed
Publication types
MeSH terms
Substances
Grants and funding
LinkOut - more resources
Full Text Sources
Other Literature Sources