

Reduced immune effector cell NKG2D expression and increased levels of soluble NKG2D ligands in multiple myeloma may not be causally linked
- PMID: 20024547
- PMCID: PMC11030819
- DOI: 10.1007/s00262-009-0807-3
Reduced immune effector cell NKG2D expression and increased levels of soluble NKG2D ligands in multiple myeloma may not be causally linked
Abstract
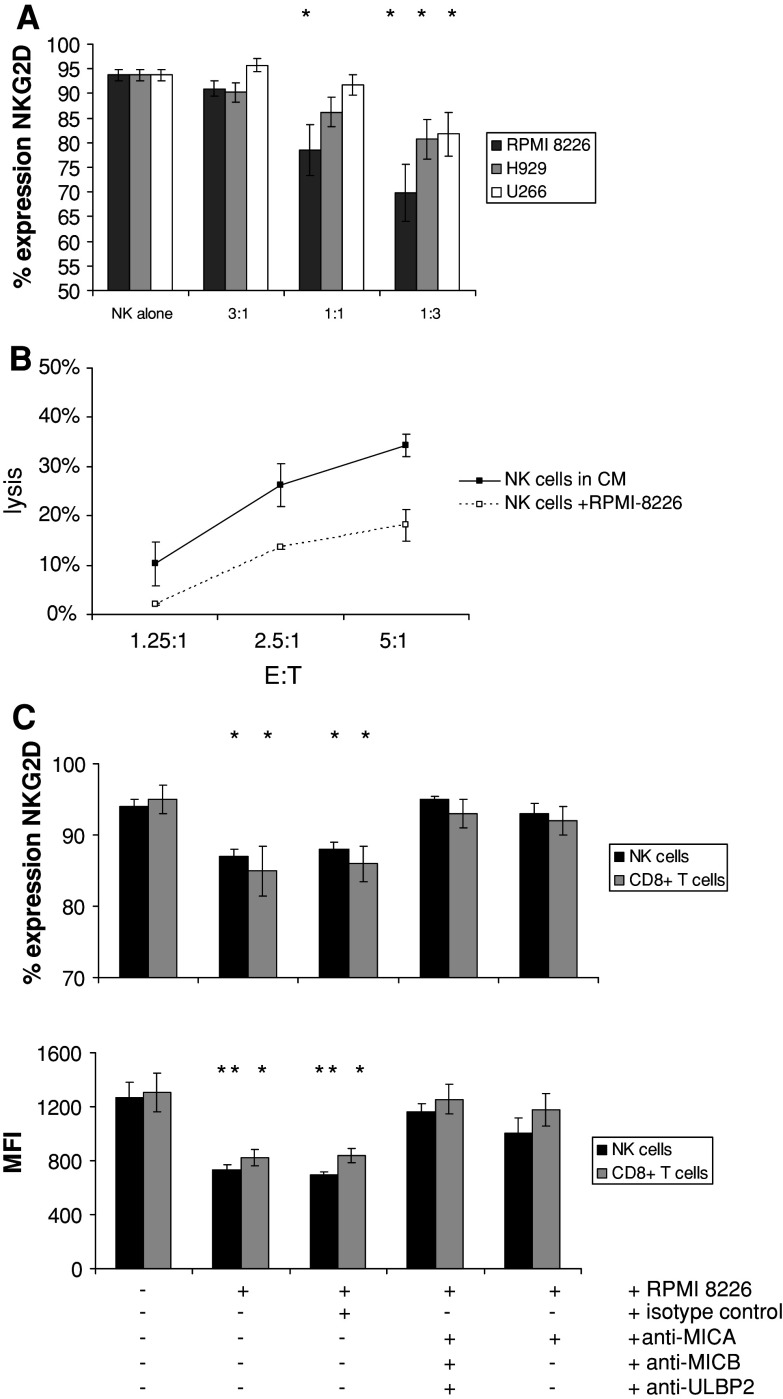
Background: There is limited understanding of the dysregulation of the innate immune system in multiple myeloma (MM). We analysed the expression of the activating receptor NKG2D on NK cells and T cells of MM patients and investigated the impact of soluble versus membrane-bound NKG2D ligands on the expression of NKG2D.
Design: NKG2D expression on NK cells and CD8+ alphabeta T cells from patients with MM or monoclonal gammopathy of uncertain significance and healthy controls was examined flow-cytometrically. Sera from patients and controls were analysed for soluble NKG2D ligands (sNKG2D ligands).
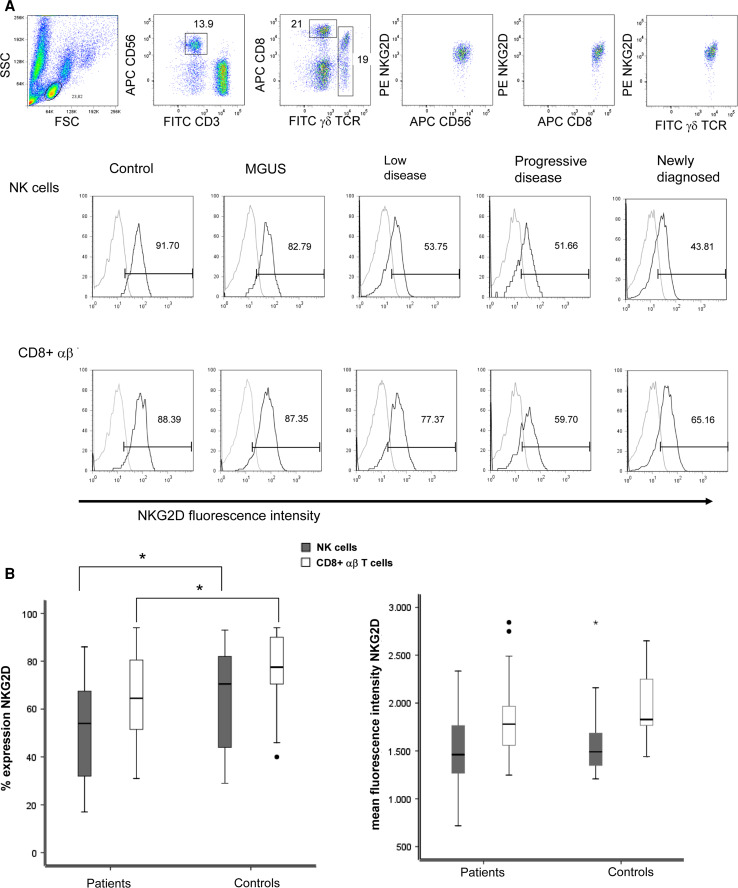
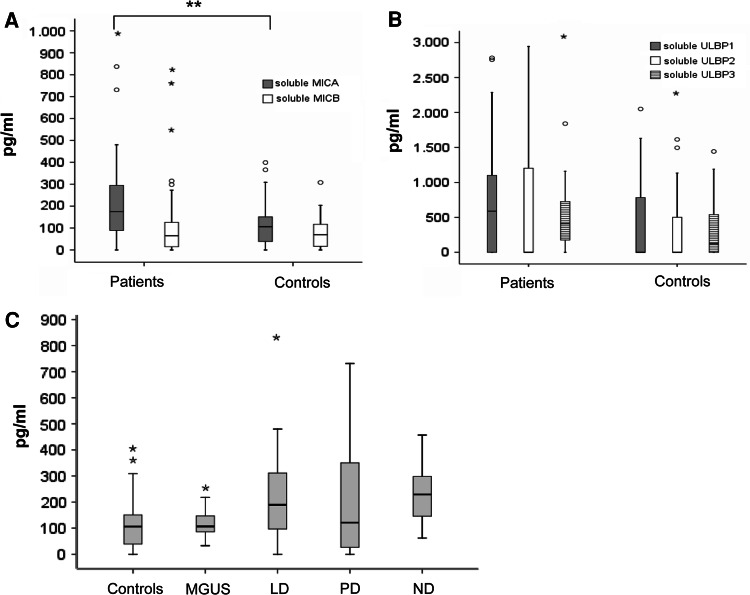
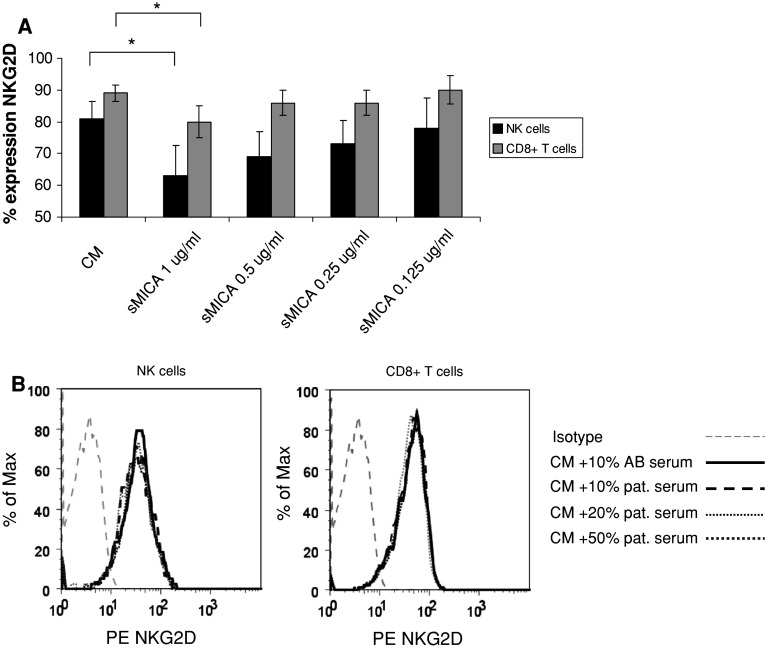
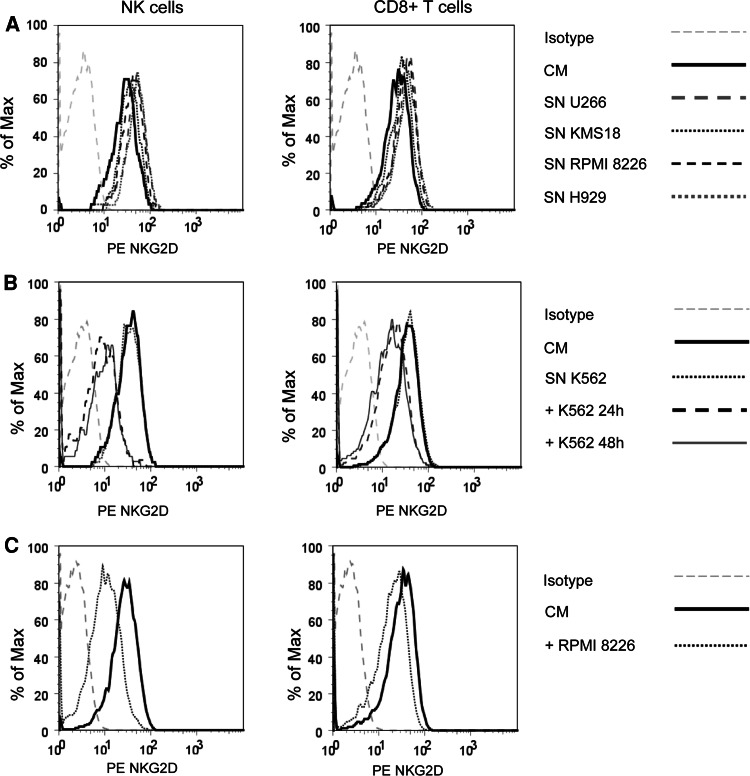
Results: Significantly fewer NK cells and CD8+ alphabeta T cells from patients expressed NKG2D compared to healthy controls (NK cells: median 54% interquartile range (IQR) 32-68 versus 71% IQR 44-82%, P = 0.017, CD8+ alphabeta T cells: median 63% IQR 52-81 versus 77% IQR 71-90%, P = 0.018). The sNKG2D ligand sMICA was increased in patients [median 175 (IQR 87-295) pg/ml] versus controls [median 80 (IQR 32-129) pg/ml, P < 0.001], but levels of sMICA did not correlate with NKG2D expression on effector cells. To elucidate the mechanism of NKG2D down-regulation, we incubated lymphocytes from healthy donors in the presence of sNKG2D ligands or in co-culture with MM cell lines. sNKG2D ligands in clinically relevant concentrations did not down-regulate NKG2D expression, but co-culture of effector cells with myeloma cells with high surface expression of NKG2D ligands reduced NKG2D expression significantly.
Conclusions: These results indicate that MM is associated with a significant reduction in NKG2D expression which may be contact-mediated rather than caused by soluble NKG2D ligands.
Figures
Similar articles
-
Soluble ligands for the NKG2D receptor are released during HIV-1 infection and impair NKG2D expression and cytotoxicity of NK cells.FASEB J. 2013 Jun;27(6):2440-50. doi: 10.1096/fj.12-223057. Epub 2013 Feb 8. FASEB J. 2013. PMID: 23395909
-
Altered NK-cell compartment and dysfunctional NKG2D/NKG2D-ligand axis in patients with ataxia-telangiectasia.Clin Immunol. 2021 Sep;230:108802. doi: 10.1016/j.clim.2021.108802. Epub 2021 Jul 21. Clin Immunol. 2021. PMID: 34298181
-
Cervical cancer cell lines expressing NKG2D-ligands are able to down-modulate the NKG2D receptor on NKL cells with functional implications.BMC Immunol. 2012 Feb 8;13:7. doi: 10.1186/1471-2172-13-7. BMC Immunol. 2012. PMID: 22316211 Free PMC article.
-
Natural killer group 2D receptor and its ligands in cancer immune escape.Mol Cancer. 2019 Feb 27;18(1):29. doi: 10.1186/s12943-019-0956-8. Mol Cancer. 2019. PMID: 30813924 Free PMC article. Review.
-
Generation of soluble NKG2D ligands: proteolytic cleavage, exosome secretion and functional implications.Scand J Immunol. 2013 Aug;78(2):120-9. doi: 10.1111/sji.12072. Scand J Immunol. 2013. PMID: 23679194 Review.
Cited by
-
Treatment with lenalidomide induces immunoactivating and counter-regulatory immunosuppressive changes in myeloma patients.Clin Exp Immunol. 2014 Aug;177(2):439-53. doi: 10.1111/cei.12343. Clin Exp Immunol. 2014. PMID: 24712857 Free PMC article.
-
Immune responses in multiple myeloma: role of the natural immune surveillance and potential of immunotherapies.Cell Mol Life Sci. 2016 Apr;73(8):1569-89. doi: 10.1007/s00018-016-2135-z. Epub 2016 Jan 22. Cell Mol Life Sci. 2016. PMID: 26801219 Free PMC article. Review.
-
Myelomagenesis: capturing early microenvironment changes.Semin Hematol. 2011 Jan;48(1):13-21. doi: 10.1053/j.seminhematol.2010.11.004. Semin Hematol. 2011. PMID: 21232654 Free PMC article. Review.
-
NKG2D triggering hampers DNAM-1-mediated signaling in human NK cells.Front Immunol. 2025 May 12;16:1575059. doi: 10.3389/fimmu.2025.1575059. eCollection 2025. Front Immunol. 2025. PMID: 40421025 Free PMC article.
-
Deciphering mechanisms of immune escape to inform immunotherapeutic strategies in multiple myeloma.J Hematol Oncol. 2022 Feb 16;15(1):17. doi: 10.1186/s13045-022-01234-2. J Hematol Oncol. 2022. PMID: 35172851 Free PMC article. Review.
References
-
- Cook G, Campbell JD, Carr CE, Boyd KS, Franklin IM. Transforming growth factor beta from multiple myeloma cells inhibits proliferation and IL-2 responsiveness in T lymphocytes. J Leukoc Biol. 1999;66:981–988. - PubMed
-
- Brown RD, Pope B, Murray A, Esdale W, Sze DM, Gibson J, Ho PJ, Hart D, Joshua D. Dendritic cells from patients with myeloma are numerically normal but functionally defective as they fail to up-regulate CD80 (B7–1) expression after huCD40LT stimulation because of inhibition by transforming growth factor-beta1 and interleukin-10. Blood. 2001;98:2992–2998. doi: 10.1182/blood.V98.10.2992. - DOI - PubMed
Publication types
MeSH terms
Substances
LinkOut - more resources
Full Text Sources
Other Literature Sources
Medical
Research Materials
