

Robust structure-based resonance assignment for functional protein studies by NMR
- PMID: 20024602
- PMCID: PMC2813526
- DOI: 10.1007/s10858-009-9390-3
Robust structure-based resonance assignment for functional protein studies by NMR
Abstract
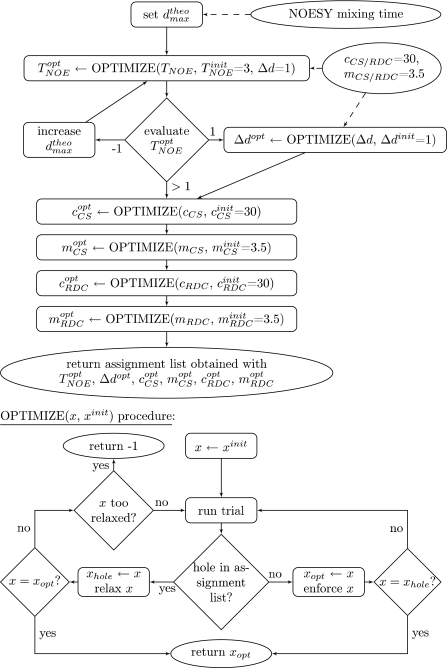
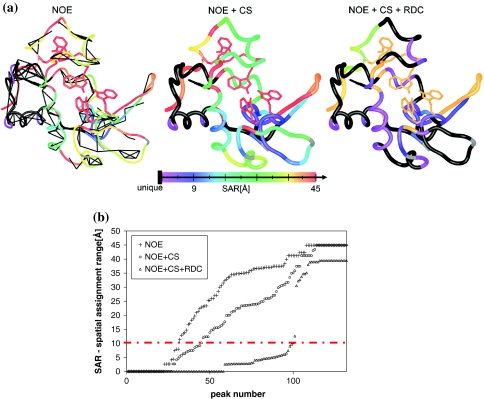
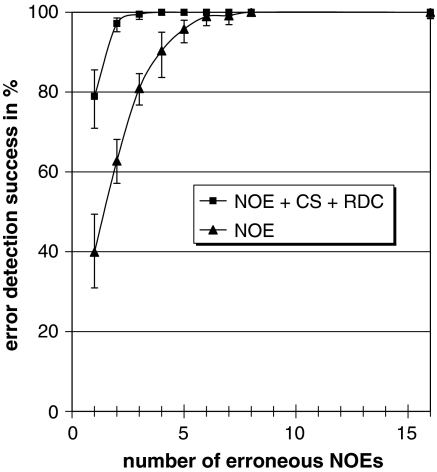
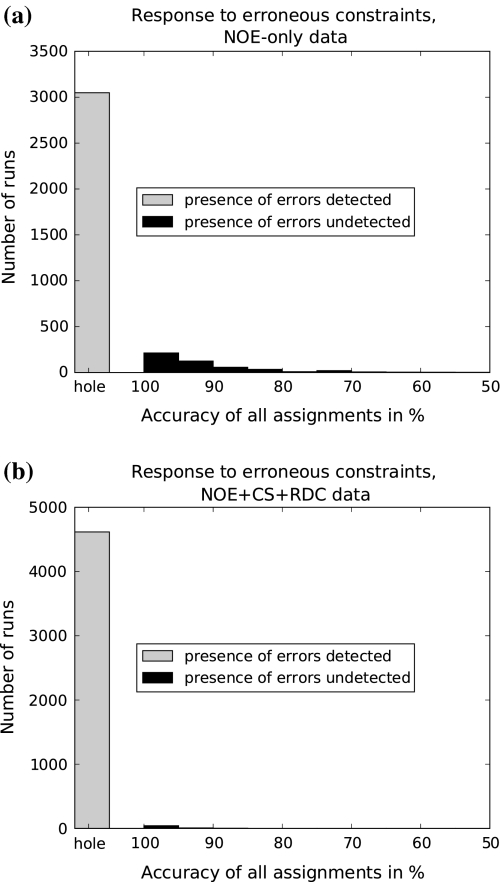
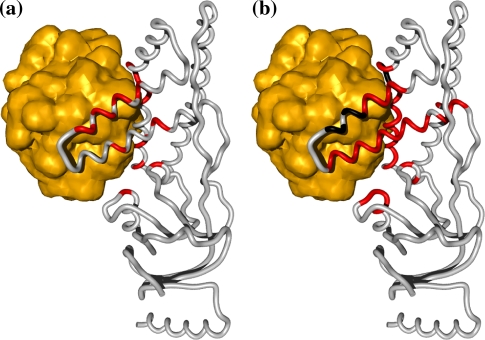
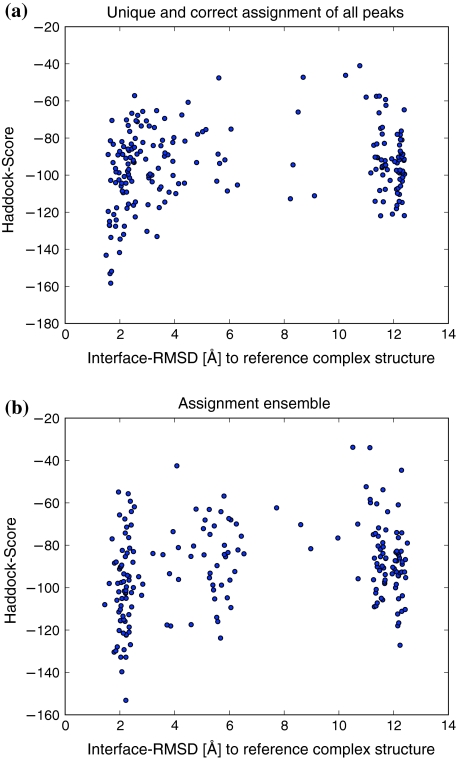
High-throughput functional protein NMR studies, like protein interactions or dynamics, require an automated approach for the assignment of the protein backbone. With the availability of a growing number of protein 3D structures, a new class of automated approaches, called structure-based assignment, has been developed quite recently. Structure-based approaches use primarily NMR input data that are not based on J-coupling and for which connections between residues are not limited by through bonds magnetization transfer efficiency. We present here a robust structure-based assignment approach using mainly H(N)-H(N) NOEs networks, as well as (1)H-(15) N residual dipolar couplings and chemical shifts. The NOEnet complete search algorithm is robust against assignment errors, even for sparse input data. Instead of a unique and partly erroneous assignment solution, an optimal assignment ensemble with an accuracy equal or near to 100% is given by NOEnet. We show that even low precision assignment ensembles give enough information for functional studies, like modeling of protein-complexes. Finally, the combination of NOEnet with a low number of ambiguous J-coupling sequential connectivities yields a high precision assignment ensemble. NOEnet will be available under: http://www.icsn.cnrs-gif.fr/download/nmr.
Figures


Similar articles
-
NOEnet--use of NOE networks for NMR resonance assignment of proteins with known 3D structure.Bioinformatics. 2009 Feb 15;25(4):474-81. doi: 10.1093/bioinformatics/btn638. Epub 2008 Dec 12. Bioinformatics. 2009. PMID: 19074506 Free PMC article.
-
Protein NMR structure determination with automated NOE assignment using the new software CANDID and the torsion angle dynamics algorithm DYANA.J Mol Biol. 2002 May 24;319(1):209-27. doi: 10.1016/s0022-2836(02)00241-3. J Mol Biol. 2002. PMID: 12051947
-
Backbone assignment of proteins with known structure using residual dipolar couplings.J Biomol NMR. 2004 Sep;30(1):25-35. doi: 10.1023/B:JNMR.0000042955.14647.77. J Biomol NMR. 2004. PMID: 15452432
-
Automated structure determination from NMR spectra.Eur Biophys J. 2009 Feb;38(2):129-43. doi: 10.1007/s00249-008-0367-z. Epub 2008 Sep 20. Eur Biophys J. 2009. PMID: 18807026 Review.
-
An introduction to biological NMR spectroscopy.Mol Cell Proteomics. 2013 Nov;12(11):3006-25. doi: 10.1074/mcp.O113.030239. Epub 2013 Jul 6. Mol Cell Proteomics. 2013. PMID: 23831612 Free PMC article. Review.
Cited by
-
RASP: rapid and robust backbone chemical shift assignments from protein structure.J Biomol NMR. 2014 Mar;58(3):155-63. doi: 10.1007/s10858-014-9813-7. Epub 2014 Jan 21. J Biomol NMR. 2014. PMID: 24445369
-
Reliable resonance assignments of selected residues of proteins with known structure based on empirical NMR chemical shift prediction.J Magn Reson. 2015 May;254:93-7. doi: 10.1016/j.jmr.2015.02.013. Epub 2015 Mar 7. J Magn Reson. 2015. PMID: 25863893 Free PMC article.
-
RDC derived protein backbone resonance assignment using fragment assembly.J Biomol NMR. 2011 Feb;49(2):85-98. doi: 10.1007/s10858-010-9467-z. Epub 2010 Dec 30. J Biomol NMR. 2011. PMID: 21191805 Free PMC article.
-
NMR Structure Determinations of Small Proteins Using only One Fractionally 20% 13C- and Uniformly 100% 15N-Labeled Sample.Molecules. 2021 Feb 1;26(3):747. doi: 10.3390/molecules26030747. Molecules. 2021. PMID: 33535444 Free PMC article.
-
Structure-Based Assignment of Ile, Leu, and Val Methyl Groups in the Active and Inactive Forms of the Mitogen-Activated Protein Kinase Extracellular Signal-Regulated Kinase 2.Biochemistry. 2015 Jul 21;54(28):4307-19. doi: 10.1021/acs.biochem.5b00506. Epub 2015 Jul 13. Biochemistry. 2015. PMID: 26132046 Free PMC article.
References
-
- Baran MC, Huang YJ, Moseley HNB, Montelione GT (2004) Automated analysis of protein NMR assignments and structures. Chem Rev 104(8):3541–3556, PMID: 15303826 - PubMed
Publication types
MeSH terms
Substances
LinkOut - more resources
Full Text Sources
