

Alaskan wild berry resources and human health under the cloud of climate change
- PMID: 20025229
- PMCID: PMC2850959
- DOI: 10.1021/jf902693r
Alaskan wild berry resources and human health under the cloud of climate change
Abstract
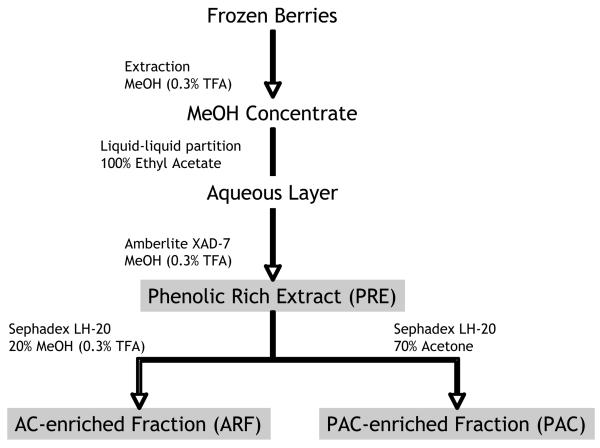
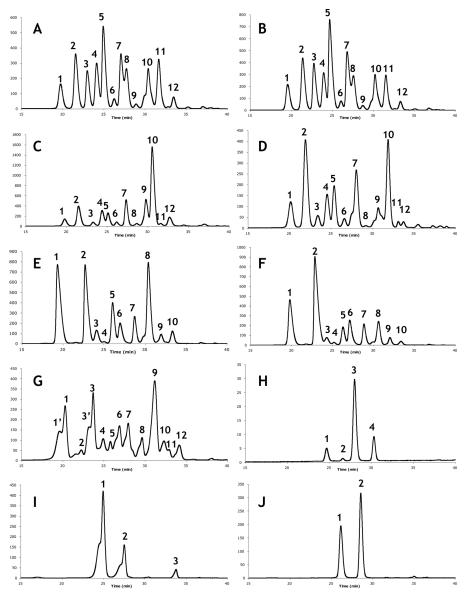
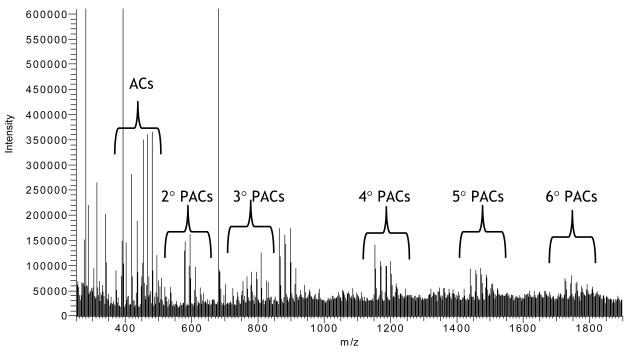
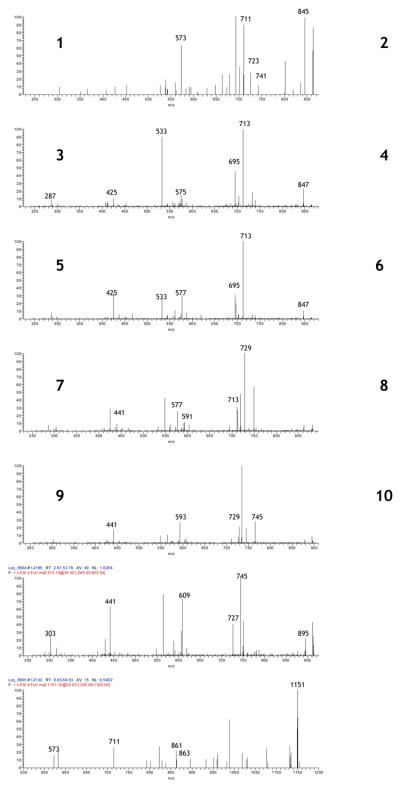
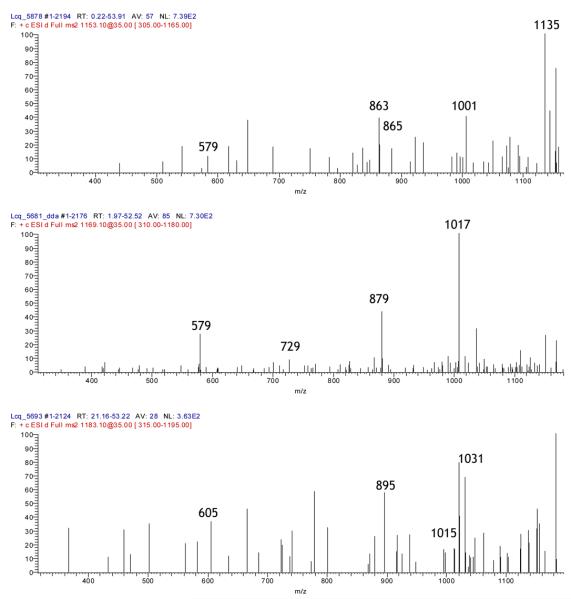
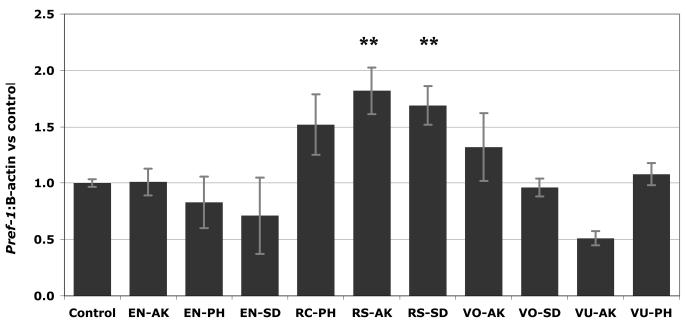
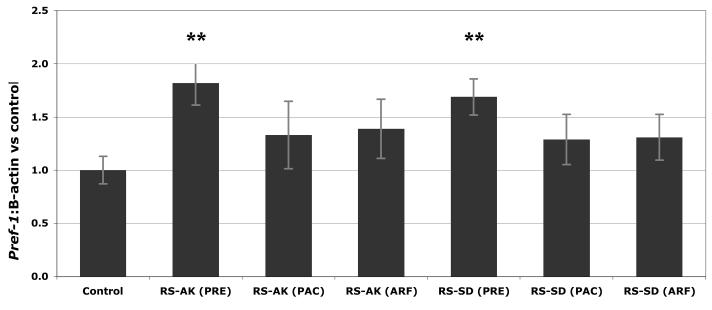
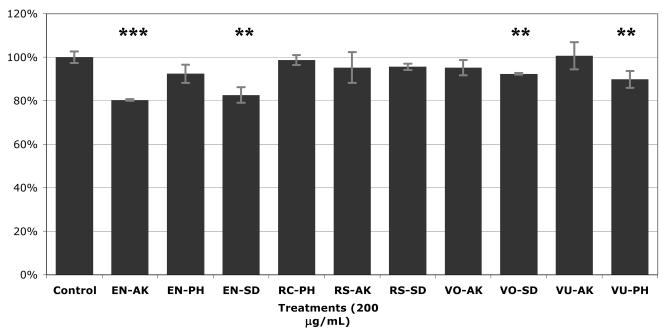
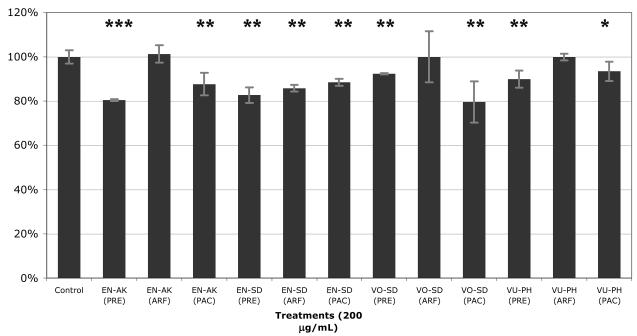
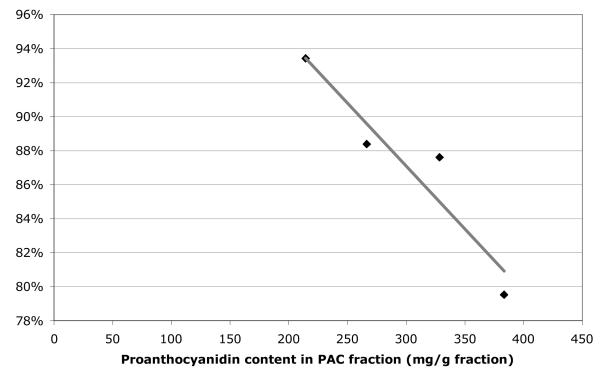
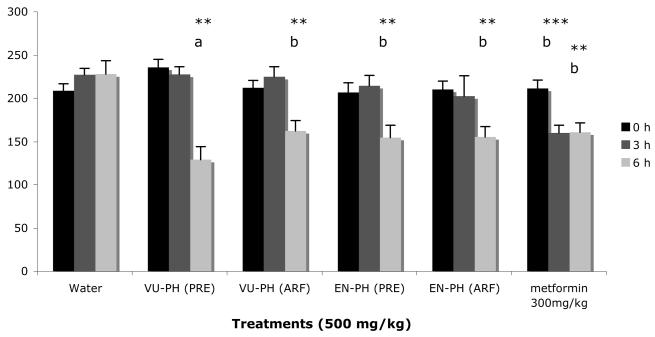
Wild berries are integral dietary components for Alaska Native people and a rich source of polyphenolic metabolites that can ameliorate metabolic disorders such as obesity and diabetes. In this study, five species of wild Alaskan berries (Vaccinium ovalifolium , Vaccinium uliginosum , Rubus chamaemorus , Rubus spectabilis , and Empetrum nigrum) were screened for bioactivity through a community-participatory research method involving three geographically distinct tribal communities. Compositional analysis by HPLC and LC-MS(2) revealed substantial site-specific variation in anthocyanins (0.01-4.39 mg/g of FW) and proanthocyanidins (0.74-6.25 mg/g of FW) and identified A-type proanthocyanidin polymers. R. spectabilis increased expression levels of preadipocyte factor 1 (182%), and proanthocyanidin-enriched fractions from other species reduced lipid accumulation in 3T3-L1 adipocytes. Selected extracts reduced serum glucose levels in C57BL/6J mice by up to 45%. Local observations provided robust insights into effects of climatic fluctuations on berry abundance and quality, and preliminary site-specific compositional and bioactivity differences were noted, suggesting the need to monitor this Alaska Native resource as climate shifts affect the region.
Figures

Similar articles
-
How are your berries? Perspectives of Alaska's environmental managers on trends in wild berry abundance.Int J Circumpolar Health. 2015 Sep 15;74:28704. doi: 10.3402/ijch.v74.28704. eCollection 2015. Int J Circumpolar Health. 2015. PMID: 26380964 Free PMC article.
-
Comparative analysis of phenolic content and profile, antioxidant capacity, and anti-inflammatory bioactivity in wild Alaskan and commercial Vaccinium berries.J Agric Food Chem. 2014 May 7;62(18):4007-17. doi: 10.1021/jf403810y. Epub 2013 Nov 19. J Agric Food Chem. 2014. PMID: 24219831 Free PMC article.
-
Berry fruits: compositional elements, biochemical activities, and the impact of their intake on human health, performance, and disease.J Agric Food Chem. 2008 Feb 13;56(3):627-9. doi: 10.1021/jf071988k. Epub 2008 Jan 23. J Agric Food Chem. 2008. PMID: 18211023
-
Berries and anthocyanins: promising functional food ingredients with postprandial glycaemia-lowering effects.Proc Nutr Soc. 2016 Aug;75(3):342-55. doi: 10.1017/S0029665116000240. Epub 2016 May 12. Proc Nutr Soc. 2016. PMID: 27170557 Review.
-
Vaccinium uliginosum and Vaccinium myrtillus-Two Species-One Used as a Functional Food.Nutrients. 2023 Sep 23;15(19):4119. doi: 10.3390/nu15194119. Nutrients. 2023. PMID: 37836403 Free PMC article. Review.
Cited by
-
Indigenous health and climate change.Am J Public Health. 2012 Jul;102(7):1260-6. doi: 10.2105/AJPH.2012.300752. Epub 2012 May 17. Am J Public Health. 2012. PMID: 22594718 Free PMC article.
-
Anti-Obesity Effects of Morus alba L. and Aronia melanocarpa in a High-Fat Diet-Induced Obese C57BL/6J Mouse Model.Foods. 2021 Aug 18;10(8):1914. doi: 10.3390/foods10081914. Foods. 2021. PMID: 34441691 Free PMC article.
-
Therapeutic Effect of Blueberry Extracts for Acute Myeloid Leukemia.Int J Biopharm Sci. 2018 Jan;1(1):102. Epub 2018 Jan 2. Int J Biopharm Sci. 2018. PMID: 29607443 Free PMC article.
-
Cloudberry (Rubus chamaemorus L.) Supplementation Attenuates the Development of Metabolic Inflammation in a High-Fat Diet Mouse Model of Obesity.Nutrients. 2022 Sep 17;14(18):3846. doi: 10.3390/nu14183846. Nutrients. 2022. PMID: 36145221 Free PMC article.
-
The Influence of Film and Storage on the Phenolic and Antioxidant Properties of Red Raspberries (Rubus idaeus L.) cv. Erika.Antioxidants (Basel). 2019 Jul 30;8(8):254. doi: 10.3390/antiox8080254. Antioxidants (Basel). 2019. PMID: 31366095 Free PMC article.
References
-
- Centers for Disease Control & Prevention Diabetes Data & Trends Sep 8, http://www.cdc.gov/diabetes/statistics/prev/national/figpersons.htm.
-
- National Center for Health Statistics, Health, United States, 2008 . In Centers for Disease Control. Hyattsville, MD: 2009.
-
- American Diabetes Asociation Total prevalence of diabetes and pre-diabetes Sep 8, http://www.diabetes.org/diabetes-statistics/prevalence.jsp.
-
- Story M, Strauss K, Gilbert TJ, Brousard BA. Nutritional health and diet-related conditions. In: Rhoades ER, editor. American Indian Health. The John Hopkins University Press; Baltimore and London: 2000. pp. 201–220.
-
- Mendlein JM, Freedman DS, Peter DG, Allen B, Percy CA, Ballew C, Mokdad AH, White LL. Risk fctors for coronary heart disease among Navajo Indians. J. Nutr. 1997;127:2099S. - PubMed
Publication types
MeSH terms
Substances
Grants and funding
LinkOut - more resources
Full Text Sources
Other Literature Sources
Medical
