

Shape-coded silica nanotubes for multiplexed bioassay: rapid and reliable magnetic decoding protocols
- PMID: 20025466
- PMCID: PMC3860376
- DOI: 10.2217/nnm.09.92
Shape-coded silica nanotubes for multiplexed bioassay: rapid and reliable magnetic decoding protocols
Abstract
Aims: The recent development of 1D barcode arrays has proved their capabilities to be applicable to highly multiplexed bioassays. This article introduces two magnetic decoding protocols for suspension arrays of shape-coded silica nanotubes to process multiplexed assays rapidly and easily, which will benefit the minimization and automation of the arrays.
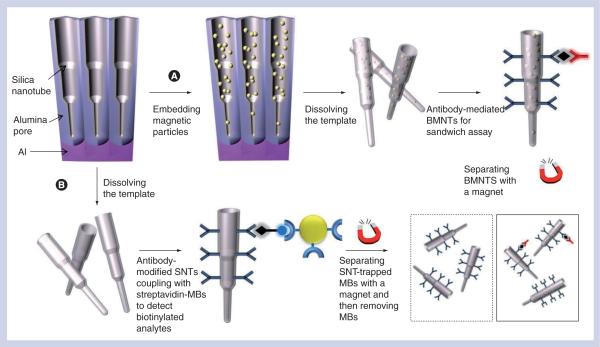
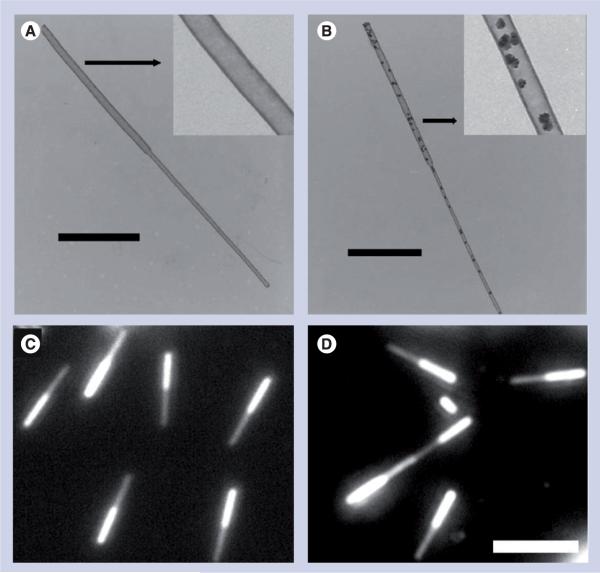
Methods: In the first protocol, the magnetic nanocrystals are incorporated into the inner voids of barcoded silica nanotubes in order to give the nanotubes magnetic properties. The second protocol is performed by trapping the barcoded silica nanotubes onto streptavidin-modified magnetic beads.
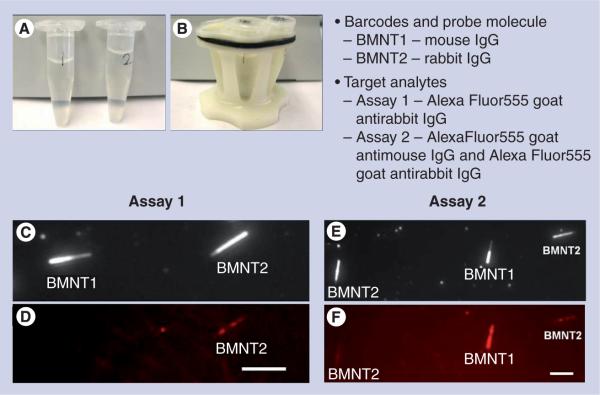
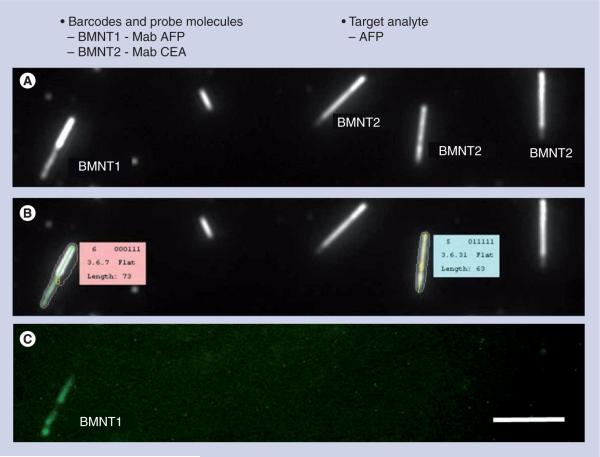
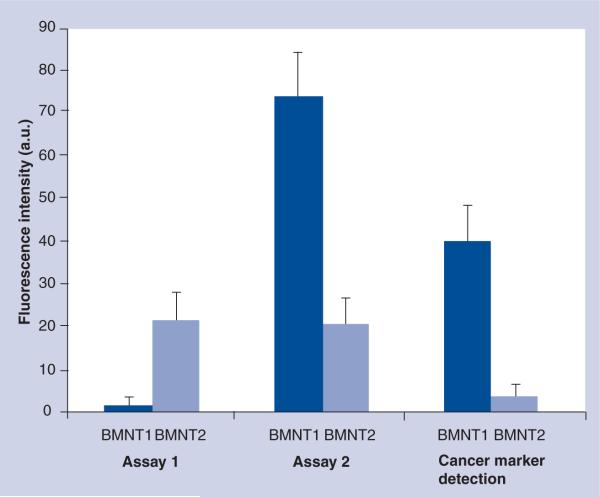
Results: The rapid and easy decoding process was demonstrated by applying the above two protocols to multiplexed assays, resulting in high selectivity. Furthermore, the magnetic bead-trapped barcode nanotubes provided a great opportunity to exclude the use of dye molecules in multiplexed assays by using barcode nanotubes as signals.
Conclusion: The rapid and easy manipulation of encoded carriers using magnetic properties could be used to develop promising suspension arrays for portable bioassays.
Figures
Similar articles
-
Suspension array with shape-coded silica nanotubes for multiplexed immunoassays.Anal Chem. 2007 Jul 15;79(14):5257-63. doi: 10.1021/ac0704964. Epub 2007 Jun 7. Anal Chem. 2007. PMID: 17552495
-
Magnetic silica nanotubes: synthesis, drug release, and feasibility for magnetic hyperthermia.ACS Appl Mater Interfaces. 2012 Apr;4(4):2303-9. doi: 10.1021/am300469r. Epub 2012 Apr 16. ACS Appl Mater Interfaces. 2012. PMID: 22486255
-
Preparation and analytical application of mimetic enzyme hemin-loading magnetic silica nanotubes.J Nanosci Nanotechnol. 2010 Sep;10(9):5783-9. doi: 10.1166/jnn.2010.2505. J Nanosci Nanotechnol. 2010. PMID: 21133105
-
Bio-templated silica composites for next-generation biomedical applications.Adv Colloid Interface Sci. 2017 Nov;249:272-289. doi: 10.1016/j.cis.2017.04.011. Epub 2017 Apr 29. Adv Colloid Interface Sci. 2017. PMID: 28499603 Review.
-
Encoded anisotropic particles for multiplexed bioanalysis.Wiley Interdiscip Rev Nanomed Nanobiotechnol. 2010 Nov-Dec;2(6):578-600. doi: 10.1002/wnan.96. Wiley Interdiscip Rev Nanomed Nanobiotechnol. 2010. PMID: 20890960 Review.
Cited by
-
Nanostructural Engineering of Nanoporous Anodic Alumina for Biosensing Applications.Materials (Basel). 2014 Jul 18;7(7):5225-5253. doi: 10.3390/ma7075225. Materials (Basel). 2014. PMID: 28788127 Free PMC article. Review.
-
Nanoporous Anodic Alumina Photonic Crystals for Optical Chemo- and Biosensing: Fundamentals, Advances, and Perspectives.Nanomaterials (Basel). 2018 Oct 4;8(10):788. doi: 10.3390/nano8100788. Nanomaterials (Basel). 2018. PMID: 30287772 Free PMC article. Review.
-
Nanoporous anodic alumina platforms: engineered surface chemistry and structure for optical sensing applications.Sensors (Basel). 2014 Jul 7;14(7):11878-918. doi: 10.3390/s140711878. Sensors (Basel). 2014. PMID: 25004150 Free PMC article. Review.
-
Experimental considerations on the cytotoxicity of nanoparticles.Nanomedicine (Lond). 2011 Jul;6(5):929-41. doi: 10.2217/nnm.11.77. Nanomedicine (Lond). 2011. PMID: 21793681 Free PMC article.
-
Nanodetoxification: emerging role of nanomaterials in drug intoxication treatment.Nanomedicine (Lond). 2011 Jul;6(5):921-8. doi: 10.2217/nnm.11.75. Nanomedicine (Lond). 2011. PMID: 21793680 Free PMC article.
References
-
- Ferrari M. Cancer nanotechnology: opportunities and challenges. Nat. Rev. Cancer. 2005;5:161–171. - PubMed
-
▪ Excellent review of cancer nanotechnology with the definitive idea on multifunctionality.
-
- Jain KK. Nanodiagnostics: application of nanotechnology in molecular diagnostics. Exp. Rev. Mol. Diagn. 2003;3:153–161. - PubMed
-
- Stears RL, Martinsky T, Schena M. Trends in microarray analysis. Nat. Med. 2003;9:140–145. - PubMed
-
- Templin MF, Stoll D, Schrenk M, Traub PC, Vohringer CF, Joos TO. Protein microarray technology. Trends Biotechnol. 2002;20:160–166. - PubMed
Publication types
MeSH terms
Substances
Grants and funding
LinkOut - more resources
Full Text Sources