

Programmable nano-bio-chips: multifunctional clinical tools for use at the point-of-care
- PMID: 20025471
- PMCID: PMC3063103
- DOI: 10.2217/nnm.09.94
Programmable nano-bio-chips: multifunctional clinical tools for use at the point-of-care
Erratum in
- Nanomedicine (Lond). 2013 Jan;8(1):160
Abstract
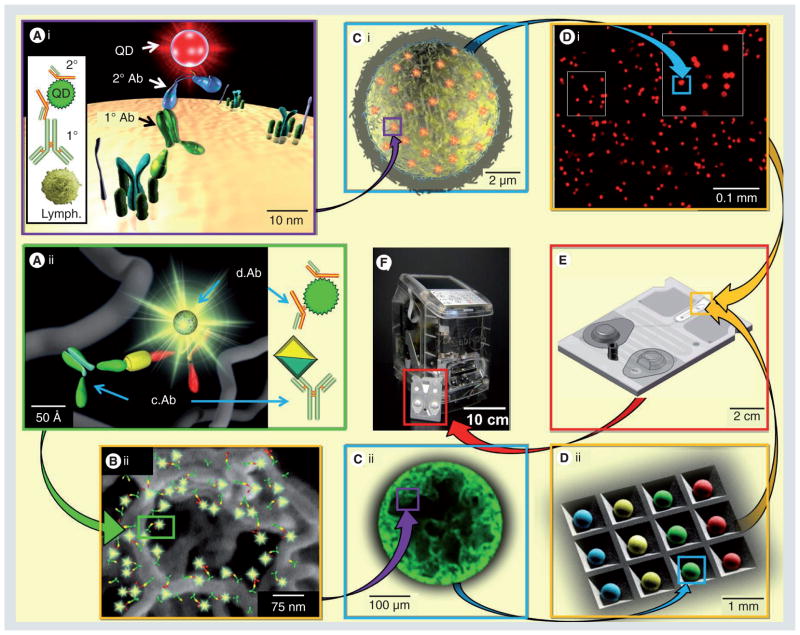
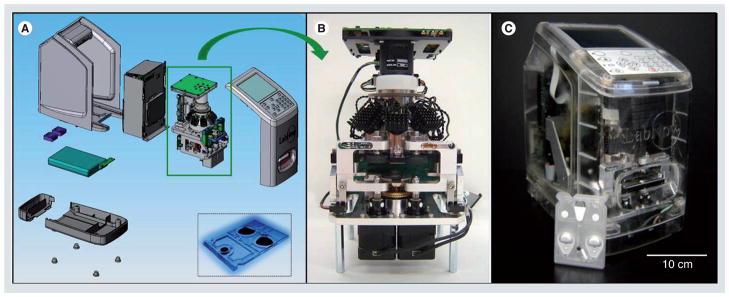
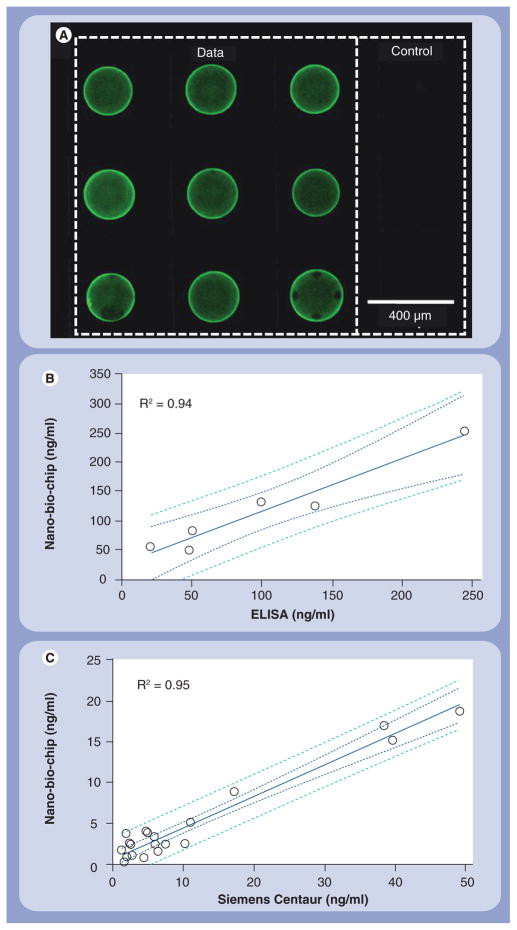
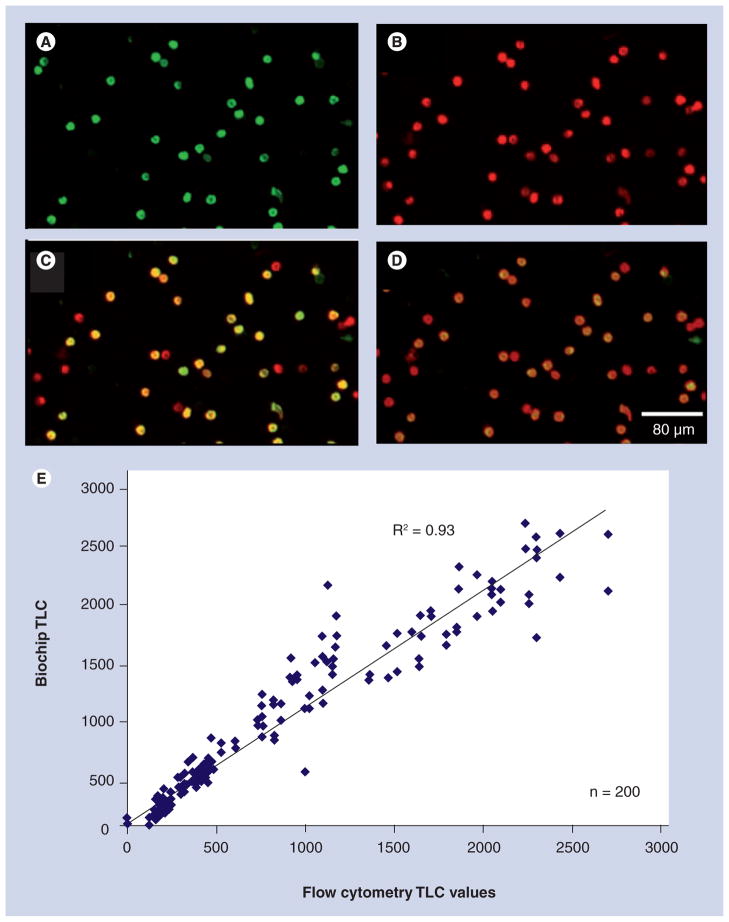
A new generation of programmable diagnostic devices is needed to take advantage of information generated from the study of genomics, proteomics, metabolomics and glycomics. This report describes the 'programmable nano-bio-chip' with potential to bridge the significant scientific, technology and clinical gaps through the creation of a diagnostic platform to measure the molecules of life. This approach, with results at the point-of-care, possesses capabilities for measuring such diverse analyte classes as cells, proteins, DNA and small molecules in the same compact device. Applications such as disease diagnosis and prognosis for areas including cancer, heart disease and HIV are described. New diagnostic panels are inserted as 'plug and play' elements into the modular platform with universal assay operating systems and standard read out sequences. The nano-bio-chip ensemble exhibits excellent analytical performance and cost-effectiveness with extensive validation versus standard reference methods (R(2) = 0.95-0.99). This report describes the construction and use of two major classes of nano-bio-chip designs that serve as cellular and chemical processing units, and provides perspective on future growth in this newly emerging field of programmable nano-bio-chip sensor systems.
Figures
Similar articles
-
Innovative Programmable Bio-Nano-Chip Digitizes Biology Using Sensors That Learn Bridging Biomarker Discovery and Clinical Implementation.Front Public Health. 2017 May 22;5:110. doi: 10.3389/fpubh.2017.00110. eCollection 2017. Front Public Health. 2017. PMID: 28589118 Free PMC article. Review.
-
Programmable bio-nano-chip system: a flexible point-of-care platform for bioscience and clinical measurements.Lab Chip. 2015 Oct 21;15(20):4020-31. doi: 10.1039/c5lc00636h. Epub 2015 Aug 26. Lab Chip. 2015. PMID: 26308851 Free PMC article.
-
Nano-bio-chips for high performance multiplexed protein detection: determinations of cancer biomarkers in serum and saliva using quantum dot bioconjugate labels.Biosens Bioelectron. 2009 Aug 15;24(12):3622-9. doi: 10.1016/j.bios.2009.05.026. Epub 2009 May 27. Biosens Bioelectron. 2009. PMID: 19576756 Free PMC article.
-
Multimodal Integrated Sensor Platform for Rapid Biomarker Detection.IEEE Trans Biomed Eng. 2020 Feb;67(2):614-623. doi: 10.1109/TBME.2019.2919192. Epub 2019 Jun 19. IEEE Trans Biomed Eng. 2020. PMID: 31226063
-
Programmable bio-nanochip technology for the diagnosis of cardiovascular disease at the point-of-care.Methodist Debakey Cardiovasc J. 2012 Jan;8(1):6-12. doi: 10.14797/mdcj-8-1-6. Methodist Debakey Cardiovasc J. 2012. PMID: 22891104 Free PMC article. Review.
Cited by
-
Future Imaging Alternatives: The Clinical Non-invasive Modalities in Diagnosis of Oral Squamous Cell Carcinoma (OSCC).Open Dent J. 2015 Jul 31;9:311-8. doi: 10.2174/1874210601509010311. eCollection 2015. Open Dent J. 2015. PMID: 26464601 Free PMC article.
-
Innovative Programmable Bio-Nano-Chip Digitizes Biology Using Sensors That Learn Bridging Biomarker Discovery and Clinical Implementation.Front Public Health. 2017 May 22;5:110. doi: 10.3389/fpubh.2017.00110. eCollection 2017. Front Public Health. 2017. PMID: 28589118 Free PMC article. Review.
-
Optical imaging techniques for point-of-care diagnostics.Lab Chip. 2013 Jan 7;13(1):51-67. doi: 10.1039/c2lc40864c. Epub 2012 Oct 9. Lab Chip. 2013. PMID: 23044793 Free PMC article. Review.
-
Current development of saliva/oral fluid-based diagnostics.Tex Dent J. 2010 Jul;127(7):651-61. Tex Dent J. 2010. PMID: 20737986 Free PMC article. Review.
-
Smart-phone based computational microscopy using multi-frame contact imaging on a fiber-optic array.Lab Chip. 2013 Oct 21;13(20):4015-23. doi: 10.1039/c3lc50589h. Epub 2013 Aug 12. Lab Chip. 2013. PMID: 23939637 Free PMC article.
References
Bibliography
-
- Hanash SM, Pitteri SJ, Faca VM. Mining the plasma proteome for cancer biomarkers. Nature. 2008;452(7187):571–579. - PubMed
-
- Hunter DJ, Khoury MJ, Drazen JM. Perspective: letting the genome out of the bottle - will we get our wish? N Engl J Med. 2008;358(2):105–107. - PubMed
-
- Anderson NL, Anderson NG. The human plasma proteome. History, character, and diagnostic prospects. Mol Cell Proteomics. 2002;1(11):845–867. - PubMed
-
- Vitzthum F, Behrens F, Anderson NL, Shaw JH. Proteomics: from basic research to diagnostic application. A review of requirements and needs. J Proteome Res. 2005;4(4):1086–1097. - PubMed
-
- Yager P, Edwards T, Fu E, et al. Microfluidic diagnostic technologies for global public health. Nature. 2006;442(7101):412–418. - PubMed
Websites
-
- LabNow. [Accessed 07/30/2009]. www.labnow.com/
-
- Affymetrix. http://tinyurl.com/yh3yn43.
-
- Affymetrix. http://tinyurl.com/ygxbks8.
-
- McDevitt Research Laboratory. http://www.tastechip.com.
Publication types
MeSH terms
Substances
Grants and funding
LinkOut - more resources
Full Text Sources
Other Literature Sources