

Complete reversal of epithelial to mesenchymal transition requires inhibition of both ZEB expression and the Rho pathway
- PMID: 20025777
- PMCID: PMC2806300
- DOI: 10.1186/1471-2121-10-94
Complete reversal of epithelial to mesenchymal transition requires inhibition of both ZEB expression and the Rho pathway
Abstract
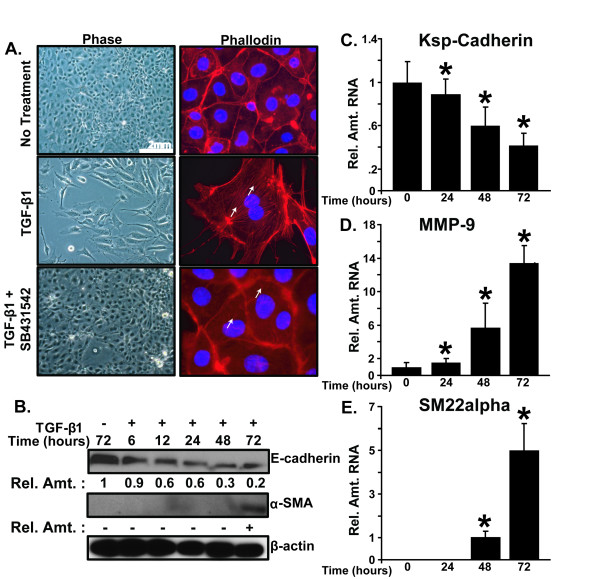
Background: Epithelial to Mesenchymal Transition (EMT) induced by Transforming Growth Factor-beta (TGF-beta) is an important cellular event in organogenesis, cancer, and organ fibrosis. The process to reverse EMT is not well established. Our purpose is to define signaling pathways and transcription factors that maintain the TGF-beta-induced mesenchymal state.
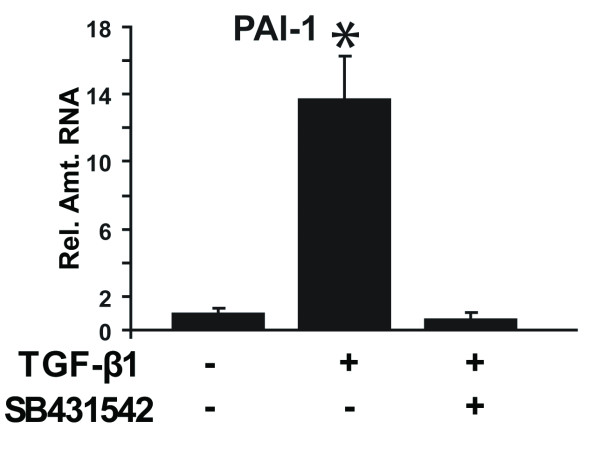
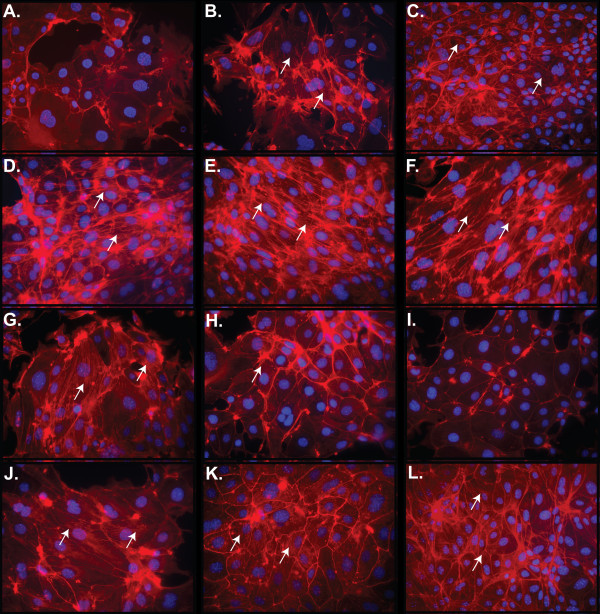
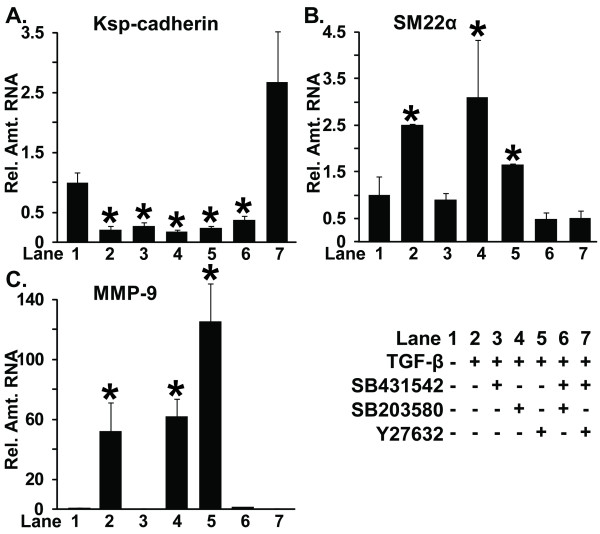
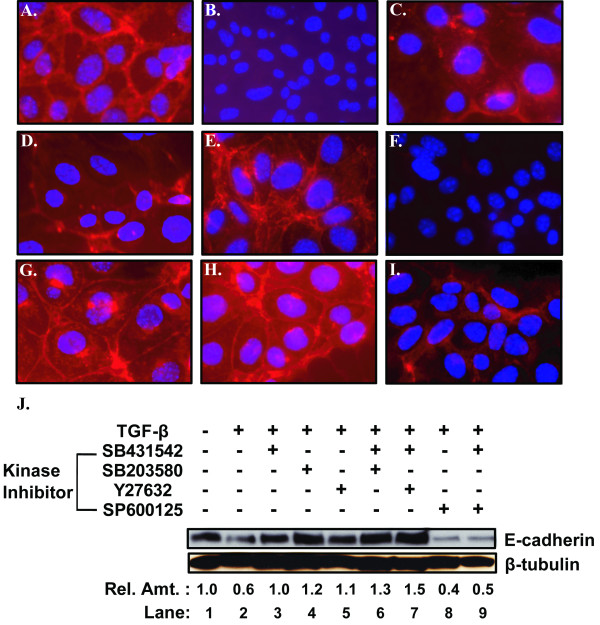
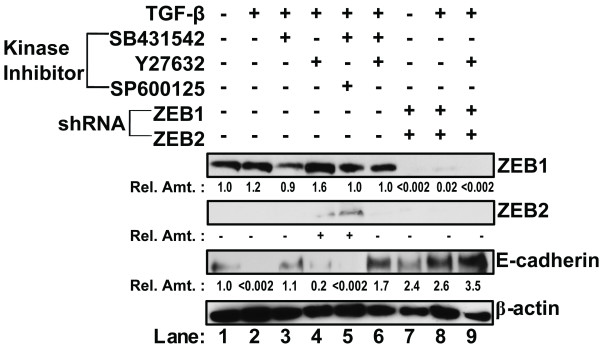
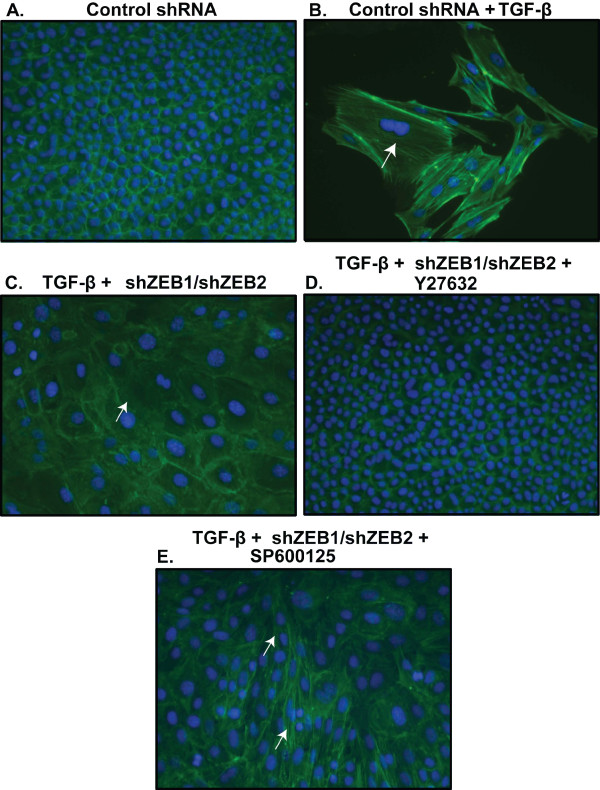
Results: Inhibitors of five kinases implicated in EMT, TGF-beta Type I receptor kinase (TbetaRI), p38 mitogen-activated protein kinase (p38 MAPK), MAP kinase kinase/extracellular signal-regulated kinase activator kinase (MEK1), c-Jun NH-terminal kinase (JNK), and Rho kinase (ROCK), were evaluated for reversal of the mesenchymal state induced in renal tubular epithelial cells. Single agents did not fully reverse EMT as determined by cellular morphology and gene expression. However, exposure to the TbetaRI inhibitor SB431542, combined with the ROCK inhibitor Y27632, eliminated detectable actin stress fibers and mesenchymal gene expression while restoring epithelial E-cadherin and Kidney-specific cadherin (Ksp-cadherin) expression. A second combination, the TbetaRI inhibitor SB431542 together with the p38 MAPK inhibitor SB203580, was partially effective in reversing EMT. Furthermore, JNK inhibitor SP600125 inhibits the effectiveness of the TbetaRI inhibitor SB431542 to reverse EMT. To explore the molecular basis underlying EMT reversal, we also targeted the transcriptional repressors ZEB1 and ZEB2/SIP1. Decreasing ZEB1 and ZEB2 expression in mouse mammary gland cells with shRNAs was sufficient to up-regulate expression of epithelial proteins such as E-cadherin and to re-establish epithelial features. However, complete restoration of cortical F-actin required incubation with the ROCK inhibitor Y27632 in combination with ZEB1/2 knockdown.
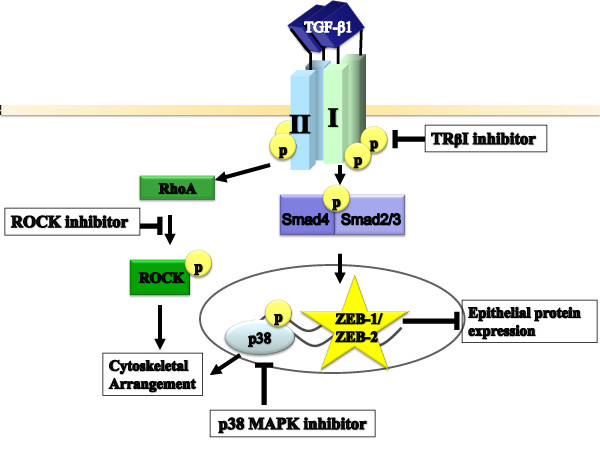
Conclusions: We demonstrate that reversal of EMT requires re-establishing both epithelial transcription and structural components by sustained and independent signaling through TbetaRI and ROCK. These findings indicate that combination small molecule therapy targeting multiple kinases may be necessary to reverse disease conditions.
Figures
Similar articles
-
Distinct mesenchymal alterations in N-cadherin and E-cadherin positive primary renal epithelial cells.PLoS One. 2012;7(8):e43584. doi: 10.1371/journal.pone.0043584. Epub 2012 Aug 17. PLoS One. 2012. PMID: 22912891 Free PMC article.
-
Differential regulation of epithelial and mesenchymal markers by deltaEF1 proteins in epithelial mesenchymal transition induced by TGF-beta.Mol Biol Cell. 2007 Sep;18(9):3533-44. doi: 10.1091/mbc.e07-03-0249. Epub 2007 Jul 5. Mol Biol Cell. 2007. PMID: 17615296 Free PMC article.
-
The miR-200 family inhibits epithelial-mesenchymal transition and cancer cell migration by direct targeting of E-cadherin transcriptional repressors ZEB1 and ZEB2.J Biol Chem. 2008 May 30;283(22):14910-4. doi: 10.1074/jbc.C800074200. Epub 2008 Apr 14. J Biol Chem. 2008. PMID: 18411277 Free PMC article.
-
Blockade of Jagged/Notch pathway abrogates transforming growth factor β2-induced epithelial-mesenchymal transition in human retinal pigment epithelium cells.Curr Mol Med. 2014 May;14(4):523-34. doi: 10.2174/1566524014666140331230411. Curr Mol Med. 2014. PMID: 24694299 Review.
-
Transforming growth factor-beta signaling in epithelial-mesenchymal transition and progression of cancer.Proc Jpn Acad Ser B Phys Biol Sci. 2009;85(8):314-23. doi: 10.2183/pjab.85.314. Proc Jpn Acad Ser B Phys Biol Sci. 2009. PMID: 19838011 Free PMC article. Review.
Cited by
-
MicroRNA-200c represses migration and invasion of breast cancer cells by targeting actin-regulatory proteins FHOD1 and PPM1F.Mol Cell Biol. 2012 Feb;32(3):633-51. doi: 10.1128/MCB.06212-11. Epub 2011 Dec 5. Mol Cell Biol. 2012. PMID: 22144583 Free PMC article.
-
Novel ROCK Inhibitors, Sovesudil and PHP-0961, Enhance Proliferation, Adhesion and Migration of Corneal Endothelial Cells.Int J Mol Sci. 2022 Nov 24;23(23):14690. doi: 10.3390/ijms232314690. Int J Mol Sci. 2022. PMID: 36499014 Free PMC article.
-
Generation of iPSCs from mouse fibroblasts with a single gene, Oct4, and small molecules.Cell Res. 2011 Jan;21(1):196-204. doi: 10.1038/cr.2010.142. Epub 2010 Oct 19. Cell Res. 2011. PMID: 20956998 Free PMC article.
-
Nc886 promotes renal cancer cell drug-resistance by enhancing EMT through Rock2 phosphorylation-mediated β-catenin nuclear translocation.Cell Cycle. 2022 Feb;21(4):340-351. doi: 10.1080/15384101.2021.2020431. Epub 2022 Jan 2. Cell Cycle. 2022. PMID: 34974812 Free PMC article.
-
miR-200b/c attenuates lipopolysaccharide-induced early pulmonary fibrosis by targeting ZEB1/2 via p38 MAPK and TGF-β/smad3 signaling pathways.Lab Invest. 2018 Mar;98(3):339-359. doi: 10.1038/labinvest.2017.123. Epub 2017 Dec 4. Lab Invest. 2018. PMID: 29200203
References
Publication types
MeSH terms
Substances
Grants and funding
LinkOut - more resources
Full Text Sources
Research Materials
Miscellaneous
