. 2010 May;170(2):278-85.
doi: 10.1016/j.jsb.2009.12.010. Epub 2009 Dec 16.

A novel approach to the structural analysis of partially decorated actin based filaments

Affiliations

A novel approach to the structural analysis of partially decorated actin based filaments

Danielle M Paul et al. J Struct Biol. 2010 May.

Abstract

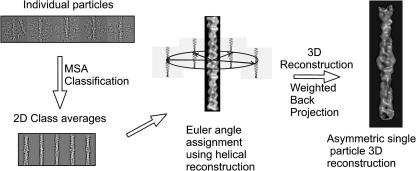
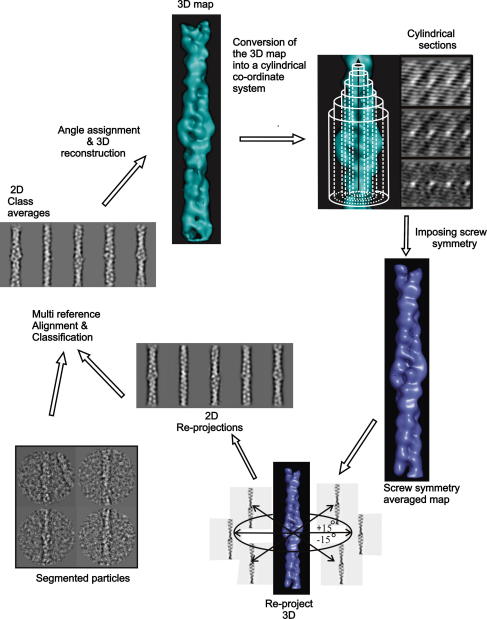
We describe a novel set of single particle based procedures for the structural analysis of electron microscope images of muscle thin filaments and other partially decorated actin based filaments. The thin filament comprises actin and the regulatory proteins tropomyosin and troponin in a 7:1:1M ratio. Prior to our work, structure analysis from electron microscope images of the thin filament has largely involved either helical averaging defined by the underlying actin helix or the use of single particle analysis but using a starting model as a reference structure. Our single particle based approach yields an accurate structure for the complete thin filament by avoiding the loss of information from troponin and tropomyosin associated with helical averaging and also removing the potential reference bias associated with the use of a starting model. The approach is more widely applicable to sub-stoichiometric complexes of F-actin and actin-binding proteins.


Figures

Fig. 1
Fig. 1
Pre-treatment of filaments. (A) Electron microscope image of a region of negatively-stained cardiac muscle thin filament exhibiting slight curvature and readily identifiable troponin densities. (B) Thin filament region shown in A after computational straightening. (C) Axial density profile of Fourier-filtered version of B in which spatial frequencies ≤200 and ≥500 Å were suppressed, allowing the identification and location of regular peaks arising from troponin. (D) Filament segments centred on the troponin density derived from B. (E) Helical reconstruction from the data used for angular assignment.
Fig. 2
Fig. 2
The initial 3D reconstruction. Classification of the individual particles was carried out using MSA. Classes of similar particles were determined and summed together creating a set of 2D class averages. The relative angles of these class angles were then determined with reference to projections of a helical reconstruction about the filament axis. Finally, a weighted back-projection algorithm is applied to reconstruct the 3D density map.
Fig. 3
Fig. 3
The refinement cycle. The initial 3D was converted into a cylindrical co-ordinate system to perform the two strand averaging that results in a screw symmetry averaged map. This averaged map was then used to calculate reference projections with up to +/−15° tilt about the short axis. These projections were used as references in the multi-reference alignment of the “raw” particles. The particles were the subject to classification and projections from the averaged structure were used to assign Euler angles to the class averages. Finally a new single particle 3D reconstruction was calculated. The cycle was repeated until no further improvements in the 3D reconstruction was observed.
Fig. 4
Fig. 4
Imposing screw symmetry. (A) The 3D density map (panel A) was converted into layers of concentric cylindrical surfaces. Panel B displays the cylindrical surfaces flattened into planes corresponding to r = 42 (Bi), & 56 Å (Bii) of the map shown in A. The radius and the distance along the filament axis are shown as the two axes r and z, respectively. The entire length of the reconstructed volume (840 Å) and two revolutions of the filament are shown in each cylindrical surface (0–720°). A single strand cannot be outlined in a single revolution of the filament. The distinct long-pitch right handed tracks of the actin strands are highlighted (Bi). The cylindrical surfaces show how the two strands differed prior to averaging and how at higher radii the contribution from the troponin density became more evident (ellipses). (C) A radial projection (average of the cylindrical surfaces from a radius of 21 to 86 Å) of the 3D map was calculated and used in the alignment of the two actin strands. The ‘short’ strand X used in the alignment procedure is indicated in Ci. The initial 180° shift of strand X to position Y is shown in Ci and the final alignment of the strands from position Y to position Z is shown in Cii. The relative shift needed to translate one strand of actin directly on top of the second strand was calculated using the radial projection. The translation was imposed on individually selected strands and each strand was added to a copy of the cylindrical surface from which it originated. The sum of the two strands at radii of 28 Å is shown in Ciii. The region where the two strands are added together appears brighter. The sum of the two strands was computationally cut from every cylindrical surface and four copies were used to create composite surfaces again applying the calculated translation. By converting the composite cylindrical surfaces back into Cartesian co-ordinates the screw symmetry averaged map was generated (D).

Similar articles

Cited by

References

    1. Al-Khayat, H.A., Morris, E.P., Kensler, R.W., Squire, J.M., 2006. 3D structure of relaxed fish muscle myosin filaments by single particle analysis. J. Struct. Biol. - PubMed
    1. Al-Khayat H.A., Morris E.P., Kensler R.W., Squire J.M. Myosin filament 3D structure in mammalian cardiac muscle. J. Struct. Biol. 2008;163:117–126. - PMC - PubMed
    1. Borland L., van Heel M. Classification of image data in conjugate representation spaces. J. Opt. Soc. Am. 1990:601–610.
    1. Bremer A., Millonig R.C., Sutterlin R., Engel A., Pollard T.D., Aebi U. The structural basis for the intrinsic disorder of the actin filament: the “lateral slipping” model. J. Cell. Biol. 1991;115:689–703. - PMC - PubMed
    1. Crowther R.A., Henderson R., Smith J.M. MRC image processing programs. J. Struct. Biol. 1996;116:9–16. - PubMed

Publication types

LinkOut - more resources