Electron transfer in the complex of membrane-bound human cytochrome P450 3A4 with the flavin domain of P450BM-3: the effect of oligomerization of the heme protein and intermittent modulation of the spin equilibrium
- PMID: 20026040
- PMCID: PMC2819549
- DOI: 10.1016/j.bbabio.2009.12.008
Electron transfer in the complex of membrane-bound human cytochrome P450 3A4 with the flavin domain of P450BM-3: the effect of oligomerization of the heme protein and intermittent modulation of the spin equilibrium
Abstract
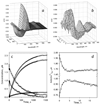
We studied the kinetics of NADPH-dependent reduction of human CYP3A4 incorporated into Nanodiscs (CYP3A4-ND) and proteoliposomes in order to probe the effect of P450 oligomerization on its reduction. The flavin domain of cytochrome P450-BM3 (BMR) was used as a model electron donor partner. Unlike CYP3A4 oligomers, where only 50% of the enzyme was shown to be reducible by BMR, CYP3A4-ND could be reduced almost completely. High reducibility was also observed in proteoliposomes with a high lipid-to-protein ratio (L/P=910), where the oligomerization equilibrium is displaced towards monomers. In contrast, the reducibililty in proteoliposomes with L/P=76 did not exceed 55+/-6%. The effect of the surface density of CYP3A4 in proteoliposomes on the oligomerization equilibrium was confirmed with a FRET-based assay employing a cysteine-depleted mutant labeled on Cys-468 with BODIPY iodoacetamide. These results confirm a pivotal role of CYP3A4 oligomerization in its functional heterogeneity. Furthermore, the investigation of the initial phase of the kinetics of CYP3A4 reduction showed that the addition of NADPH causes a rapid low-to-high-spin transition in the CYP3A4-BMR complex, which is followed by a partial slower reversal. This observation reveals a mechanism whereby the CYP3A4 spin equilibrium is modulated by the redox state of the bound flavoprotein.
Copyright 2009 Elsevier B.V. All rights reserved.
Figures


Similar articles
-
Kinetics of electron transfer in the complex of cytochrome P450 3A4 with the flavin domain of cytochrome P450BM-3 as evidence of functional heterogeneity of the heme protein.Arch Biochem Biophys. 2008 Mar 1;471(1):20-31. doi: 10.1016/j.abb.2007.11.020. Epub 2007 Dec 7. Arch Biochem Biophys. 2008. PMID: 18086551 Free PMC article.
-
Electron transfer in flavocytochrome P450 BM3: kinetics of flavin reduction and oxidation, the role of cysteine 999, and relationships with mammalian cytochrome P450 reductase.Biochemistry. 2003 Sep 16;42(36):10809-21. doi: 10.1021/bi034562h. Biochemistry. 2003. PMID: 12962506
-
Analysis of the interactions of cytochrome b5 with flavocytochrome P450 BM3 and its domains.Drug Metab Rev. 2007;39(2-3):599-617. doi: 10.1080/03602530701468458. Drug Metab Rev. 2007. PMID: 17786641
-
Flavin-containing heme enzymes.Arch Biochem Biophys. 2010 Jan 1;493(1):37-52. doi: 10.1016/j.abb.2009.10.005. Epub 2009 Oct 19. Arch Biochem Biophys. 2010. PMID: 19850002 Review.
-
P450BM-3; a tale of two domains--or is it three?Steroids. 1997 Jan;62(1):117-23. doi: 10.1016/s0039-128x(96)00169-9. Steroids. 1997. PMID: 9029725 Review.
Cited by
-
Current Approaches for Investigating and Predicting Cytochrome P450 3A4-Ligand Interactions.Adv Exp Med Biol. 2015;851:83-105. doi: 10.1007/978-3-319-16009-2_3. Adv Exp Med Biol. 2015. PMID: 26002732 Free PMC article. Review.
-
Structure and Function of the Cytochrome P450 Monooxygenase Cinnamate 4-hydroxylase from Sorghum bicolor.Plant Physiol. 2020 Jul;183(3):957-973. doi: 10.1104/pp.20.00406. Epub 2020 Apr 24. Plant Physiol. 2020. PMID: 32332088 Free PMC article.
-
Cytochrome P450 system proteins reside in different regions of the endoplasmic reticulum.Biochem J. 2014 Dec 1;464(2):241-9. doi: 10.1042/BJ20140787. Biochem J. 2014. PMID: 25236845 Free PMC article.
-
Nanodiscs in Membrane Biochemistry and Biophysics.Chem Rev. 2017 Mar 22;117(6):4669-4713. doi: 10.1021/acs.chemrev.6b00690. Epub 2017 Feb 8. Chem Rev. 2017. PMID: 28177242 Free PMC article. Review.
-
CYP2C8 exists as a dimer in natural membranes.Drug Metab Dispos. 2010 Nov;38(11):1976-83. doi: 10.1124/dmd.110.034942. Epub 2010 Aug 10. Drug Metab Dispos. 2010. PMID: 20699412 Free PMC article.
References
-
- Gigon PL, Gram TE, Gillette JR. Studies on rate of reduction of hepatic microsomal cytochrome P-450 by reduced nicotinamide adenine dinucleotide phosphate - effect of drug substrates. Mol. Pharmacol. 1969;5:109–122. - PubMed
-
- Peterson JA, Ebel RE, O'keeffe DH, Matsubara T, Estabrook RW. Temperature dependence of cytochrome P-450 reduction. A model for NADPH-cytochrome P-450 reductase:cytochrome P-450 interaction. J. Biol. Chem. 1976;251:4010–4016. - PubMed
-
- Blanck J, Smettan G, Ristau O, Ingelman-sundberg M, Ruckpaul K. Mechanism of rate control of the NADPH-dependent reduction of cytochrome P-450 by lipids in reconstituted phospholipid vesicles. Eur. J. Biochem. 1984;144:509–513. - PubMed
-
- Tamburini PP, Gibson GG, Backes WL, Sligar SG, Schenkman JB. Reduction kinetics of purified rat liver cytochrome P-450. Evidence for a sequential reaction mechanism dependent on the hemoprotein spin state. Biochemistry. 1984;23:4526–4533. - PubMed
-
- Backes WL, Tamburini PP, Jansson I, Gibson GG, Sligar SG, Schenkman JB. Kinetics of cytochrome P-450 reduction: evidence for faster reduction of the high-spin ferric state. Biochemistry. 1985;24:5130–5136. - PubMed
Publication types
MeSH terms
Substances
Grants and funding
LinkOut - more resources
Full Text Sources

