. 2010 Feb 26:1316:1-16.
doi: 10.1016/j.brainres.2009.12.025. Epub 2009 Dec 21.

Disparate developmental neurotoxicants converge on the cyclic AMP signaling cascade, revealed by transcriptional profiles in vitro and in vivo

Affiliations

Disparate developmental neurotoxicants converge on the cyclic AMP signaling cascade, revealed by transcriptional profiles in vitro and in vivo

Abayomi A Adigun et al. Brain Res. .

Abstract

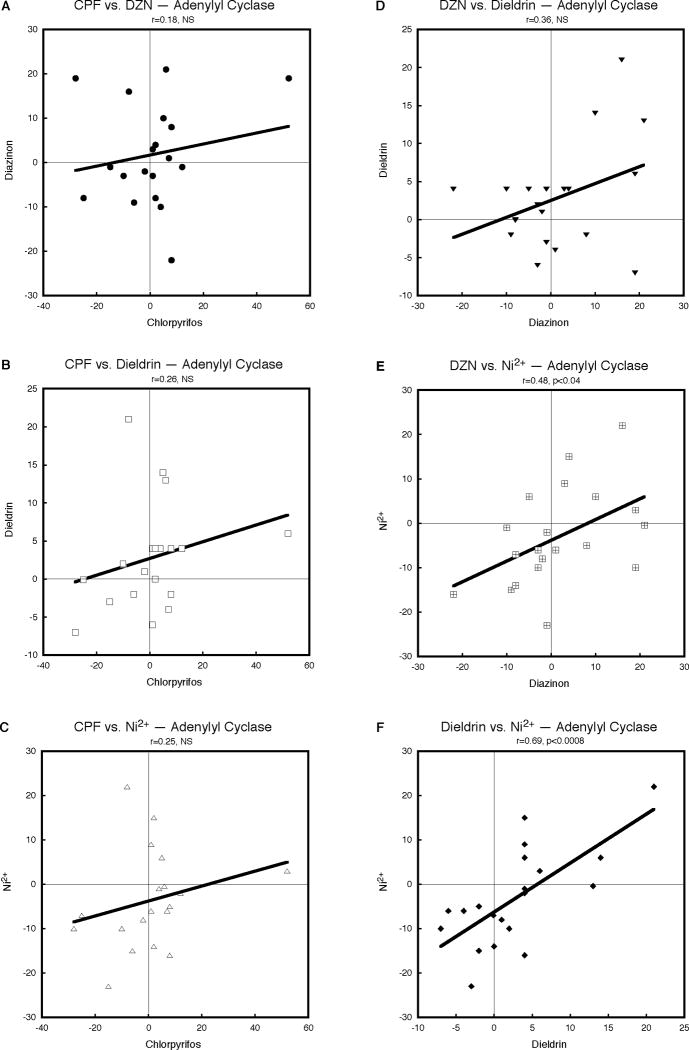
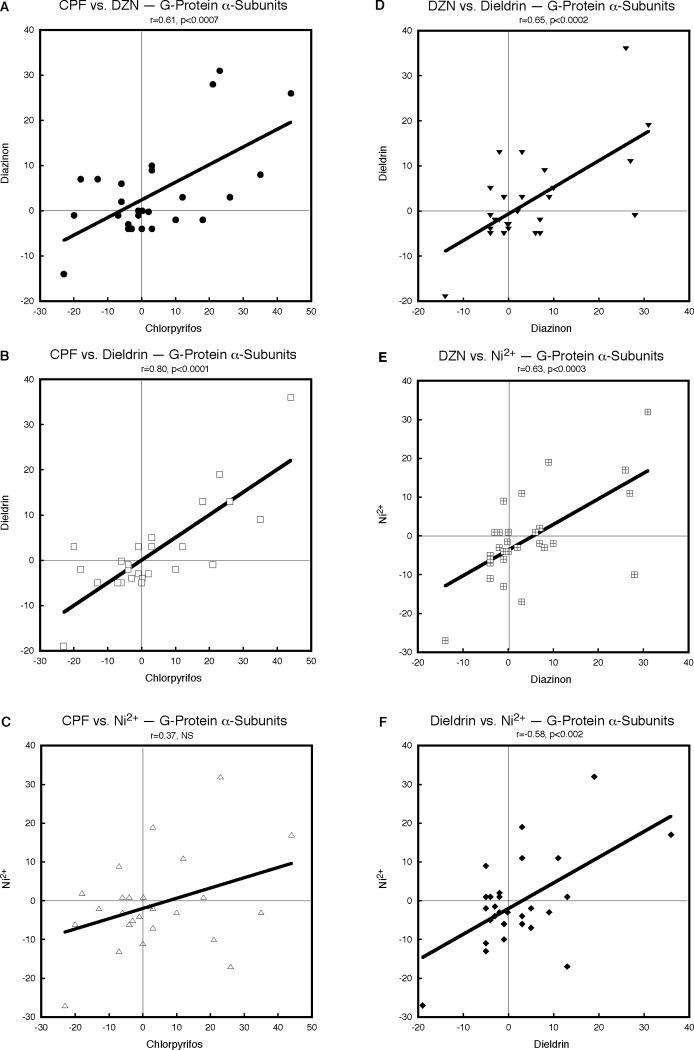
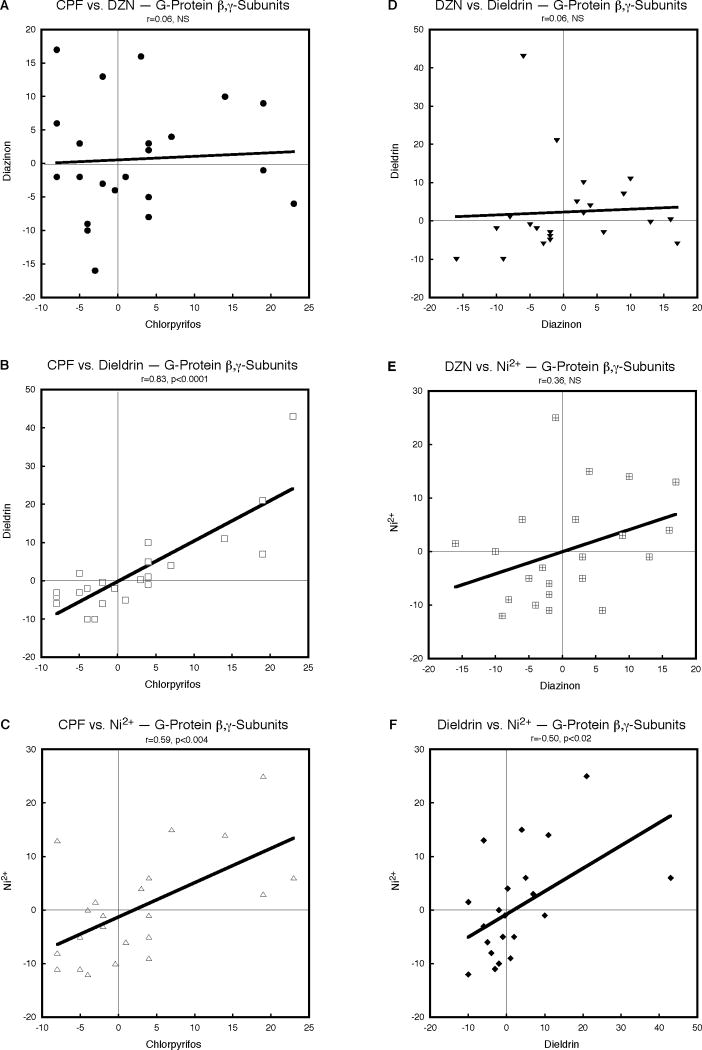
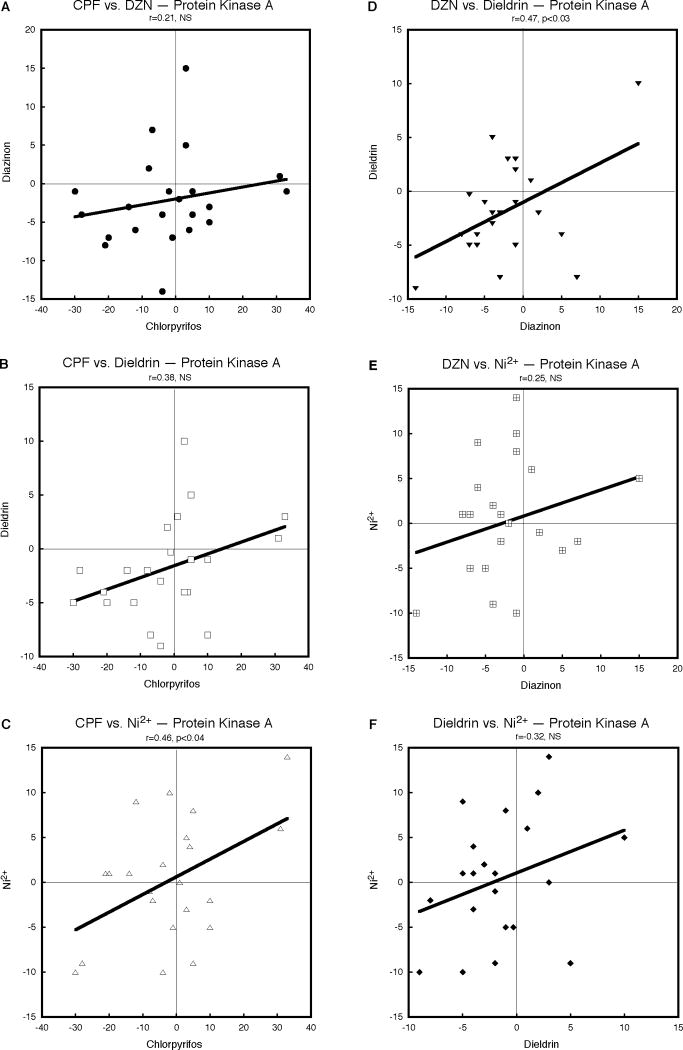
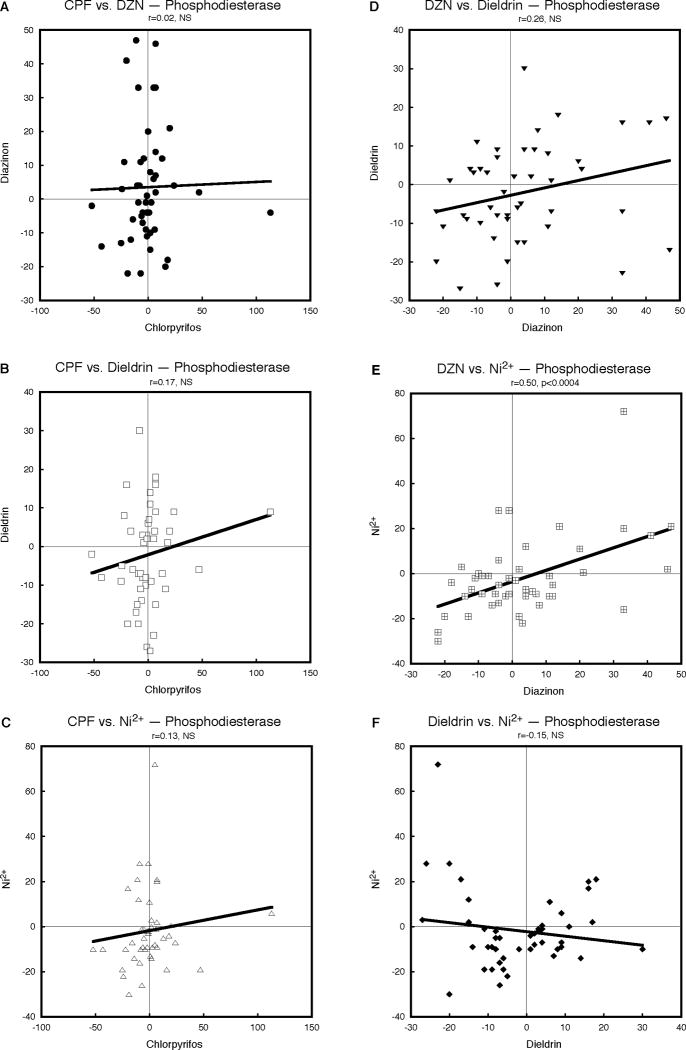
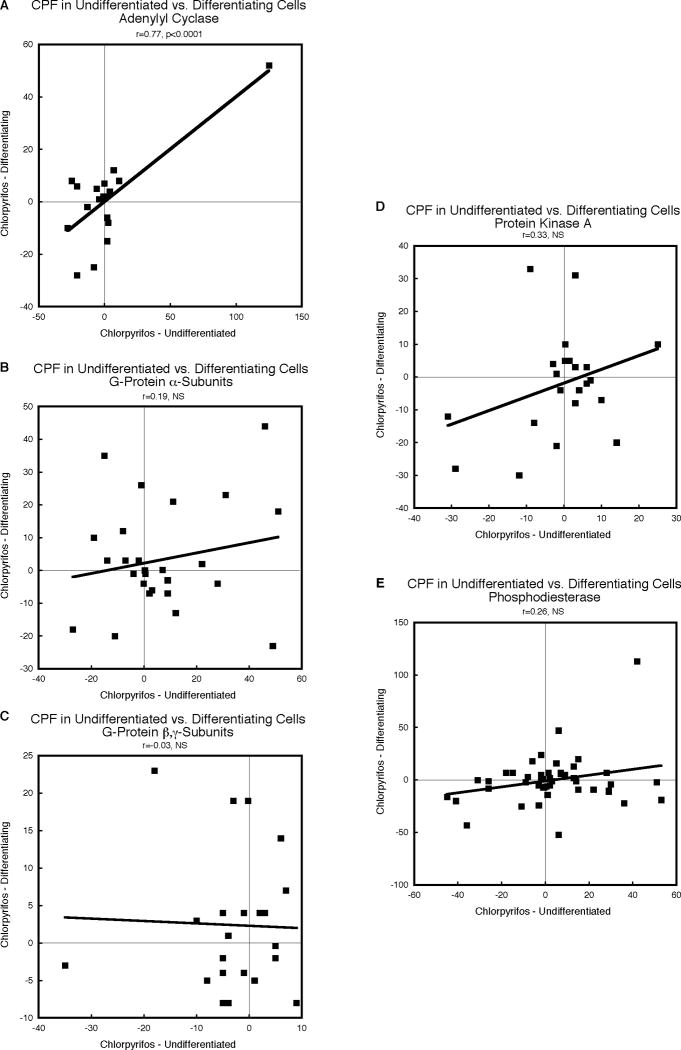
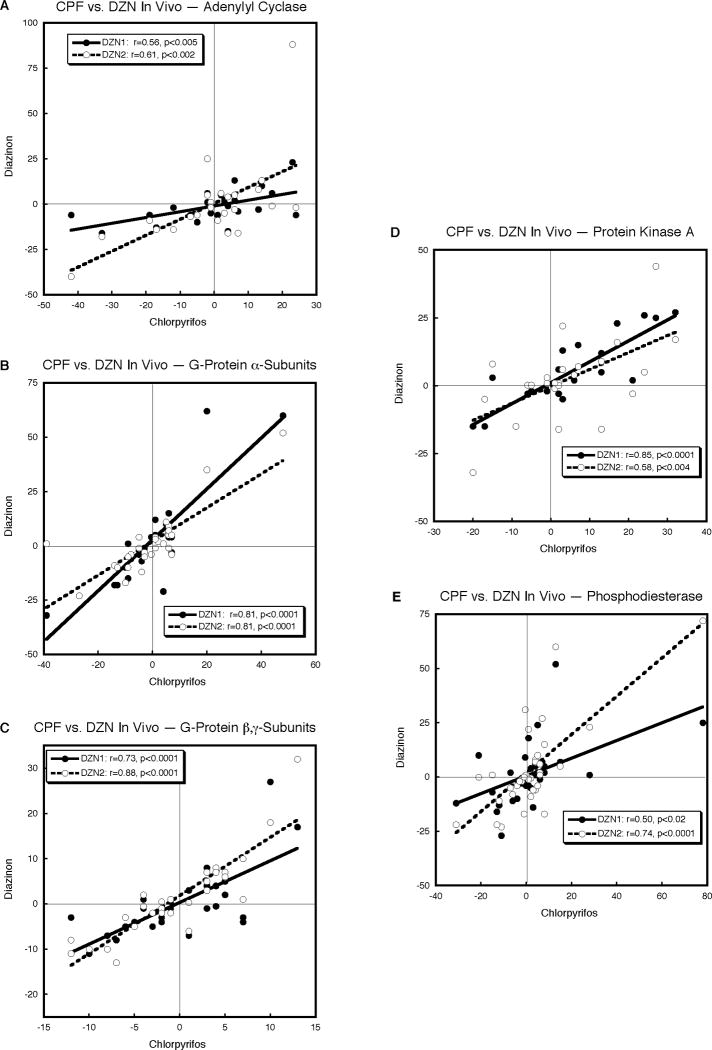
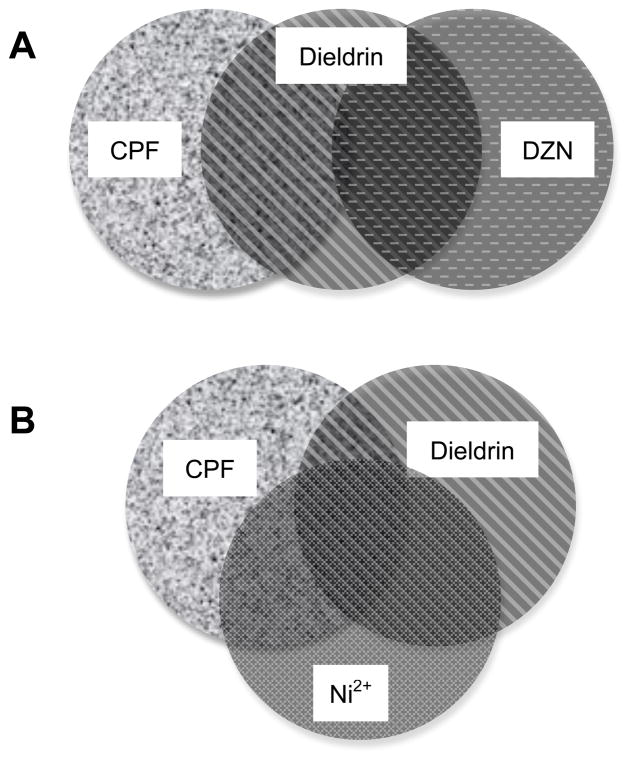
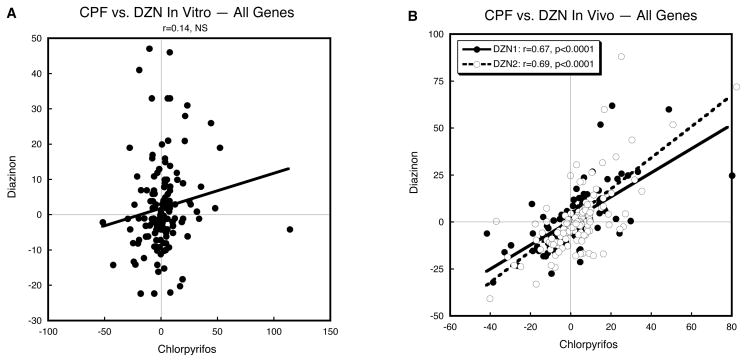
Cell-signaling cascades are convergent targets for developmental neurotoxicity of otherwise unrelated agents. We compared organophosphates (chlorpyrifos, diazinon), an organochlorine (dieldrin) and a metal (Ni(2+)) for their effects on neuronotypic PC12 cells, assessing gene transcription involved in the cyclic AMP pathway. Each agent was introduced during neurodifferentiation at a concentration of 30 microM for 24 or 72 h and we assessed 69 genes encoding adenylyl cyclase isoforms and regulators, G-protein alpha-and beta,gamma-subunits, protein kinase A subtypes and the phosphodiesterase family. We found strong concordance among the four agents across all the gene families, with the strongest relationships for the G-proteins, followed by adenylyl cyclase, and lesser concordance for protein kinase A and phosphodiesterase. Superimposed on this pattern, chlorpyrifos and diazinon were surprisingly the least alike, whereas there was strong concordance of dieldrin and Ni(2+) with each other and with each individual organophosphate. Further, the effects of chlorpyrifos differed substantially depending on whether cells were undifferentiated or differentiating. To resolve the disparities between chlorpyrifos and diazinon, we performed analyses in rat brain regions after in vivo neonatal exposures; unlike the in vitro results, there was strong concordance. Our results show that unrelated developmental neurotoxicants can nevertheless produce similar outcomes by targeting cell signaling pathways involved in neurodifferentiation during a critical developmental period of vulnerability. Nevertheless, a full evaluation of concordance between different toxicants requires evaluations of in vitro systems that detect direct effects, as well as in vivo systems that allow for more complex interactions that converge on the same pathway.


Figures

Figure 1
Figure 1
Pairwise correlations of the effects of CPF, DZN, dieldrin and Ni2+ on expression of AC genes, calculated from Supplemental Tables 1 and 2 as the percent change from corresponding control values. Linear correlation coefficients are shown at the top of each panel and the line represents the least-squares fit of the data. NS, not significant.
Figure 2
Figure 2
Pairwise correlations of the effects of CPF, DZN, dieldrin and Ni2+ on expression of G-protein α-subunit genes, calculated from Supplemental Tables 1 and 2 as the percent change from corresponding control values. Linear correlation coefficients are shown at the top of each panel and the line represents the least-squares fit of the data. NS, not significant.
Figure 3
Figure 3
Pairwise correlations of the effects of CPF, DZN, dieldrin and Ni2+ on expression of G-protein β,γ-subunit genes, calculated from Supplemental Tables 1 and 2 as the percent change from corresponding control values. Linear correlation coefficients are shown at the top of each panel and the line represents the least-squares fit of the data. NS, not significant.
Figure 4
Figure 4
Pairwise correlations of the effects of CPF, DZN, dieldrin and Ni2+ on expression of protein kinase A genes, calculated from Supplemental Tables 1 and 2 as the percent change from corresponding control values. Linear correlation coefficients are shown at the top of each panel and the line represents the least-squares fit of the data. NS, not significant.
Figure 5
Figure 5
Pairwise correlations of the effects of CPF, DZN, dieldrin and Ni2+ on expression of phosphodiesterase genes, calculated from Supplemental Tables 1 and 2 as the percent change from corresponding control values. Linear correlation coefficients are shown at the top of each panel and the line represents the least-squares fit of the data. NS, not significant.
Figure 6
Figure 6
Correlations of the effects of CPF on undifferentiated versus differentiating cells for each the five classes of genes, calculated from Supplemental Tables 1 and 2 as the percent change from corresponding control values: AC (A), G-protein α-subunits (B), G-protein β,γsubunits (C), protein kinase A (D) and phosphodiesterase (E). Linear correlation coefficients are shown at the top of each panel and the line represents the least-squares fit of the data. NS, not significant.
Figure 7
Figure 7
Correlations of the effects of CPF (1 mg/kg) and DZN (1 or 2 mg/kg) on gene expression in vivo, evaluated on postnatal day 5 in forebrain and brainstem from neonatal rats given each agent daily from postnatal days 1–4: AC (A), G-protein α-subunits (B), G-protein β,γ-subunits (C), protein kinase A (D) and phosphodiesterase (E). Linear correlation coefficients are shown within each panel and the line represents the least-squares fit of the data.
Figure 8
Figure 8
Venn diagram illustrating the relationships among CPF, DZN, dieldrin and Ni2+ for their global effects on the five classes of genes as calculated in Table 1. (A) CPF and dieldrin have strong concordance, as do DZN and dieldrin, but the effects of CPF and DZN are only weakly related because the gene effects shared between CPF and dieldrin differ from those involved in the correlation of DZN and dieldrin. (B) CPF, dieldrin and Ni2+ all share common patterns of effects on gene expression.
Figure 9
Figure 9
Comparison of in vitro (A) and in vivo (B) correlations of gene expression values combined from all five classes. Linear correlation coefficients are shown at the top of each panel and the line represents the least-squares fit of the data. NS, not significant.

Similar articles

Cited by

References

    1. Adigun AA, Wrench N, Seidler FJ, Slotkin TA. Neonatal organophosphorus pesticide exposure alters the developmental trajectory of cell signaling cascades controlling metabolism: differential effects of diazinon and parathion. Environ Health Perspect. 2009 in press. - PMC - PubMed
    1. Aldridge JE, Seidler FJ, Slotkin TA. Developmental exposure to chlorpyrifos elicits sex-selective alterations of serotonergic synaptic function in adulthood: critical periods and regional selectivity for effects on the serotonin transporter, receptor subtypes, and cell signaling. Environ Health Perspect. 2004;112:148–155. - PMC - PubMed
    1. Aldridge JE, Levin ED, Seidler FJ, Slotkin TA. Developmental exposure of rats to chlorpyrifos leads to behavioral alterations in adulthood, involving serotonergic mechanisms and resembling animal models of depression. Environ Health Perspect. 2005;113:527–531. - PMC - PubMed
    1. Bagchi D, Bagchi M, Hassoun EA, Stohs SJ. In vitro and in vivo generation of reactive oxygen species, DNA damage and lactate dehydrogenase leakage by selected pesticides. Toxicology. 1995;104:129–140. - PubMed
    1. Bagchi D, Bhattacharya G, Stohs SJ. In vitro and in vivo induction of heat shock (stress) protein (Hsp) gene expression by selected pesticides. Toxicology. 1996;112:57–68. - PubMed

Publication types